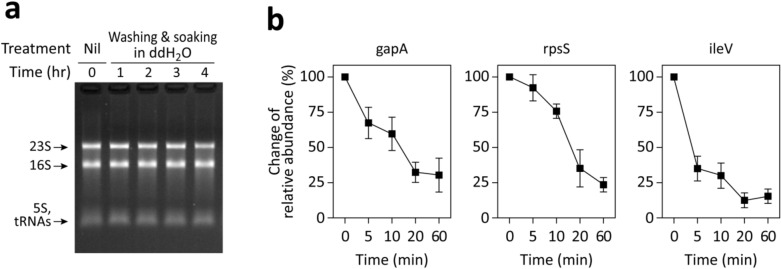
Figure 4.
RNA degradation in starved E. coli. (a) E. coli was washed, soaked in ddH2O at 37℃, and RNA was extracted at the specified time points using the RNA snap ™ method for electrophoresis analysis. Notable bands, likely representing 23S, 16S, 5S rRNA, and tRNAs, are identified. (b) Alterations in the relative abundances of two mRNAs (gapA and rpsS) and one tRNA (ileV) following washing and soaking in ddH2O are presented. At designated times, total RNA was purified, converted to cDNA via reverse transcription. The relative cDNA abundance of each target compared to the 16S rRNA was quantified using semi-quantitative PCR. The data depict changes in relative abundances, with the baseline (t = 0 min) set to 100%. The data represent the mean ± SD of three experiments.

