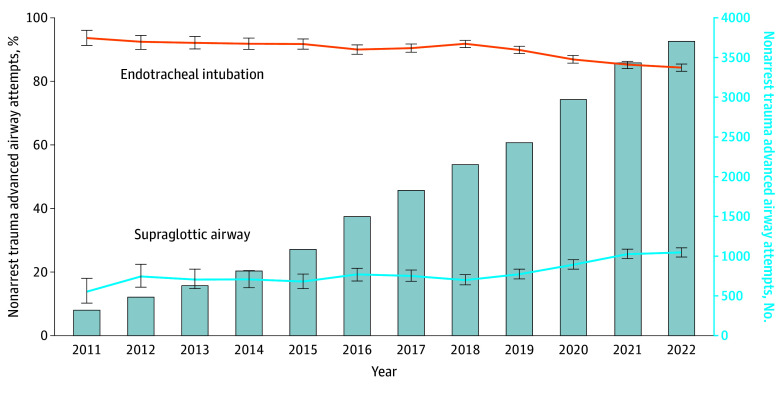
Figure 3. Longitudinal Trends in the Annual Percentage of Nonarrest Trauma Endotracheal Intubation or Supraglottic Airway Insertion Attempts.
Data are from the 2011 to 2022 ESO Data Collaborative. Markers and whiskers indicate percentages and respective 95% CIs. Bar graph depicts total number of trauma nonarrests with advanced airway management attempts. Totals may exceed 100% because an individual patient may have undergone both supraglottic airway and endotracheal intubation attempts. Tests of trend from unobserved components models: endotracheal intubation P for trend = .04; supraglottic airway P for trend = .07.

