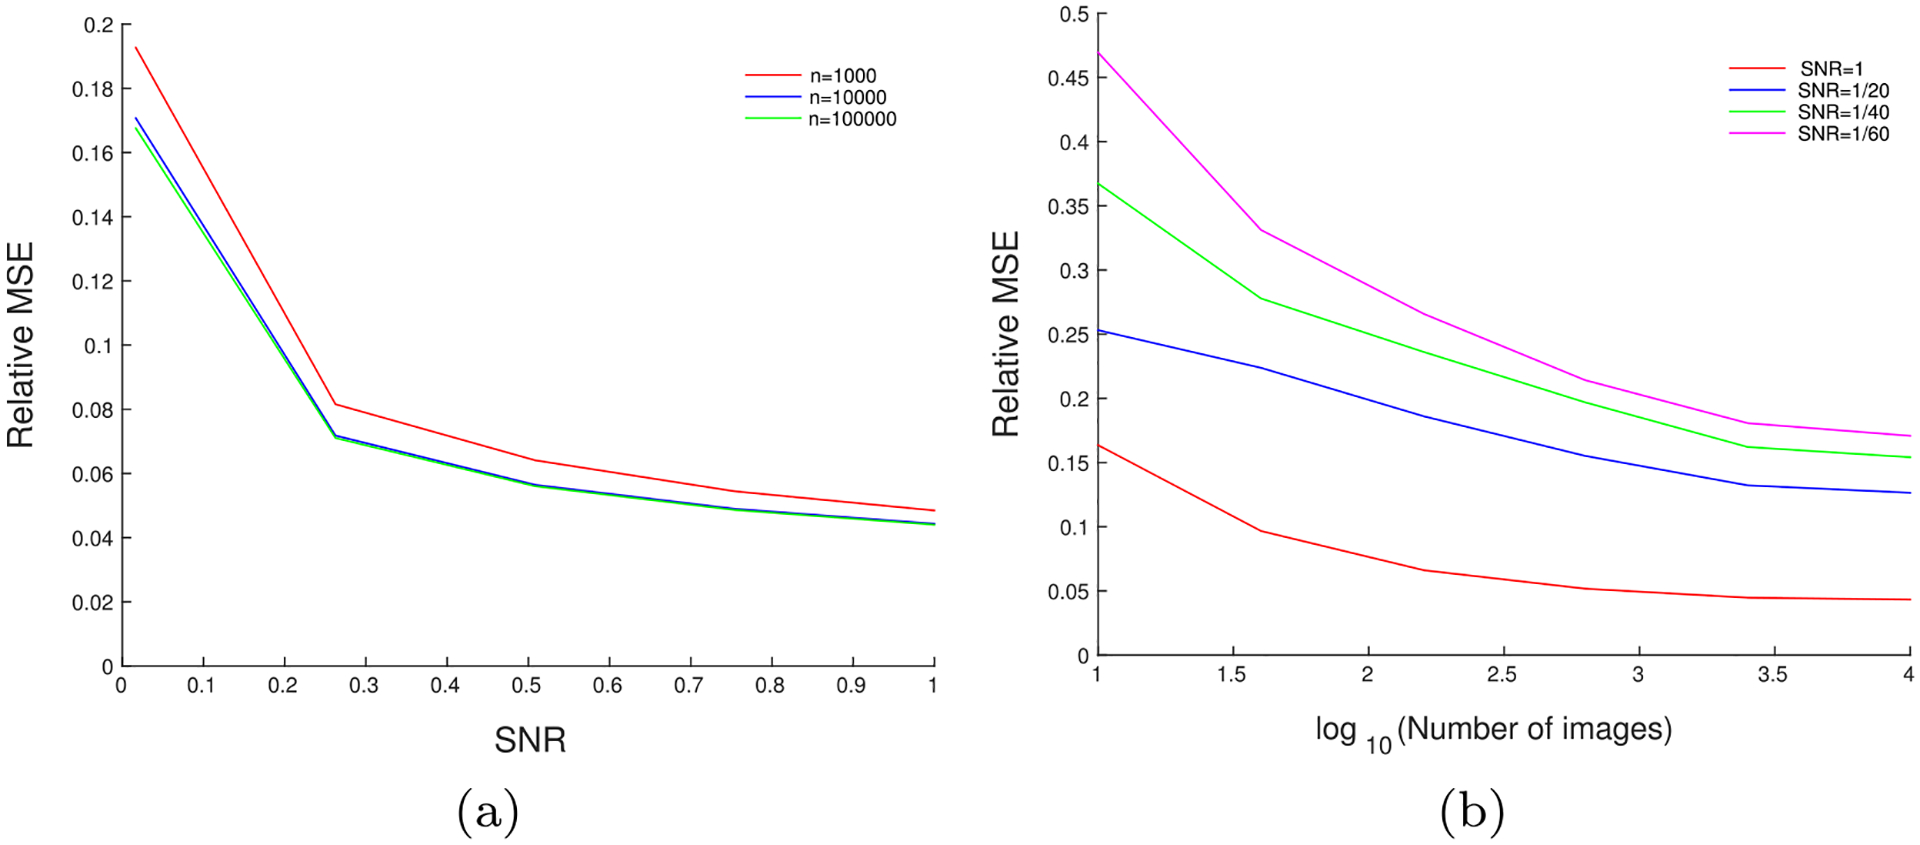
Fig. 2.

(a) Relative MSE versus the SNR, for a fixed number of images: The relative MSE of the denoised images as a function of the SNR, for synthetic data generated using EMDB-6454. The MSE reported here is averaged over all images. denotes the number of images used in the experiment. (b) Relative MSE versus the number of images, for a fixed SNR: The relative MSE of the denoised images as a function of the number of images, for synthetic data generated using EMDB-6454. The MSE reported here is averaged over all images.
