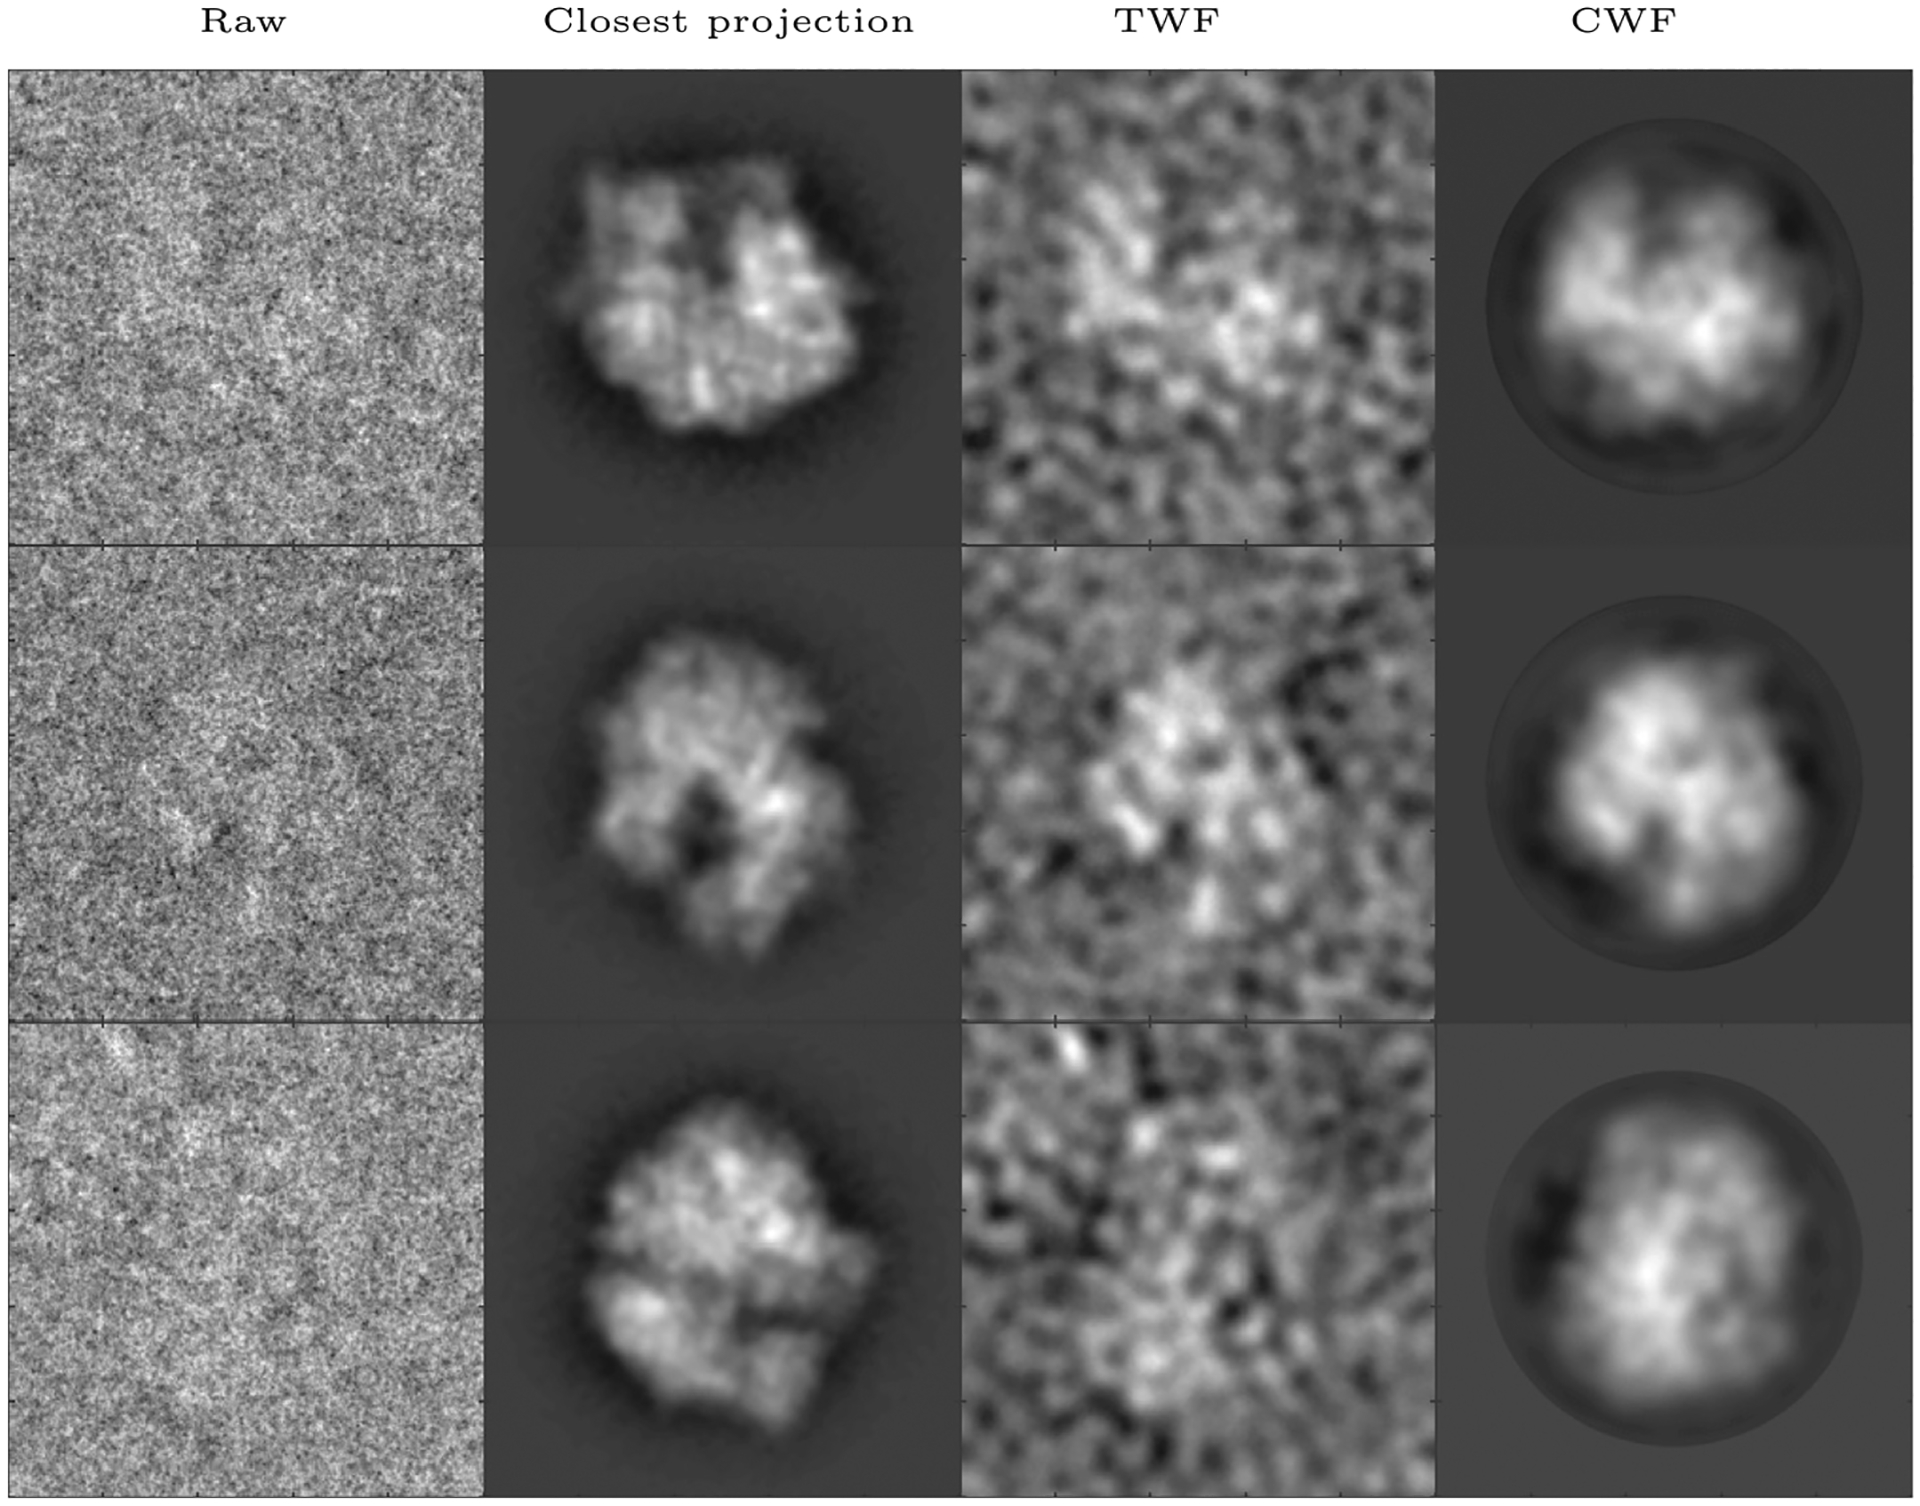
Fig. 8.

Denoising an experimental dataset of 70S (Agirrezabala et al., 2012): Here we show, for three images in the dataset, the raw image, the closest true projection image generated from the 3D reconstruction of the molecule (EMDB 5360), the denoised image obtained using TWF, and the denoised image obtained using CWF. In this experiment, the first 99,979 images out of the 216,517 images in the dataset were used for covariance estimation. The images are of size 250 × 250 and belong to 38 defocus groups. The amplitude contrast is 10%, the spherical aberration is 2.26 mm, and the voltage is 300 kV.
