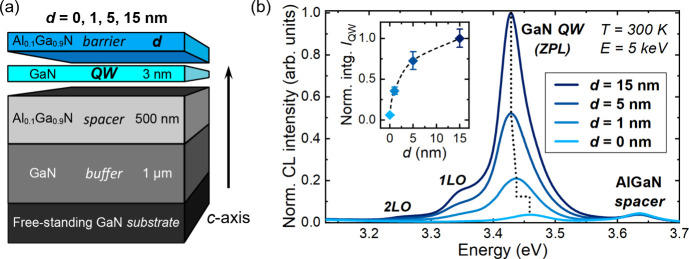
Figure 1.
(a) Sample structure of surface QWs and (b) corresponding CL spectra acquired at 300 K under an electron beam energy of 5 keV. The peaks corresponding to the AlGaN spacer emission, as well as the zero-phonon line (ZPL) and the longitudinal optical (LO) phonon replicas of the GaN QW emission, are identified. In the inset, the integrated QW intensity (IQW), including only the ZPL, is plotted as a function of surface barrier thickness (d). Some intensity error bars are not visible in the plot, as they are smaller than the size of the diamond symbol used.

