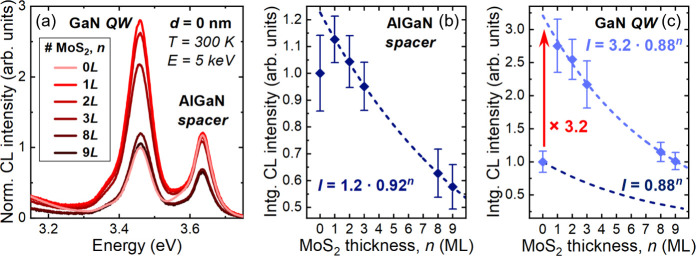
Figure 3.
(a) Average RT CL spectra collected from the uncapped GaN QW (d = 0 nm) in areas with varying MoS2 thicknesses, represented by the number of MLs (n). All spectra are normalized to the peak intensity of the GaN QW emission in the region without MoS2 (0L). Normalized integrated CL intensity as a function of MoS2 thickness for (b) the AlGaN spacer emission and (c) the GaN QW emission. The dashed lines represent the fits assuming the same absorption is occurring in each ML-MoS2, with the corresponding expression next to them.

