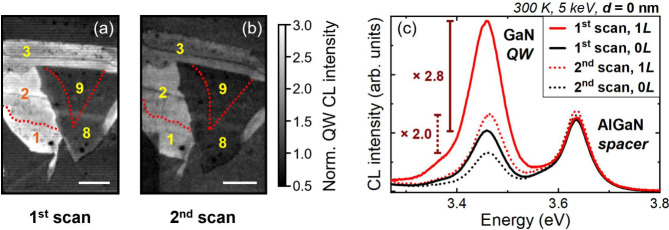
Figure 4.
RT integrated GaN QW CL intensity maps of (a) the 1st scan and (b) the 2nd scan, where the numbers in yellow/orange indicate the number of MoS2 MLs in the corresponding region. The red dotted lines are drawn to highlight unclear boundaries between different regions, based on the MoS2 thickness-dependent color contrast shown in Figure 2a. Both maps are normalized by the respective average intensity in the region without MoS2, and are plotted using a linear intensity scale ranging from 0.5 to 3. Scale bars correspond to a length of 5 μm. The dark rectangular area in the left lower corner of the 2nd map is a result of a small-scale measurement conducted prior to this scan. (c) Average CL spectra of the background emission (0L) and the emission from the region covered by ML-MoS2 (1L), extracted from the two scans. The dark rectangular area in the 2nd map is excluded from the estimation of the average spectra.

