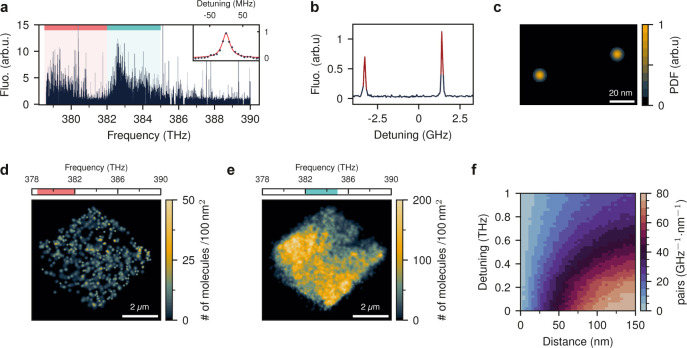
Figure 2.
Spatial and spectral distribution of DBT molecules in printed organic crystals. (a) Fluorescence excitation spectrum from 1 μm2 of a printed DBT:Ac microcrystal recorded at 2 K. The inset shows an example of a high-resolution spectrum of a single-molecule 00ZPL. The gaps in the scanning range are due to interruptions in the laser cavity lock. The two main insertion sites of DBT in Ac are marked with red and turquoise regions. (b) Spectra of two molecules located within a diffraction-limited spot. Red curves show the data points used to localize individual molecules. (c) Probability density function (PDF) of lateral positions for the two DBT molecules in (b). The location of each emitter is represented by a Gaussian spot. (d) Super-resolution image of 589 molecules between 378.5 THz and 382 THz, i.e., the red region in (a). The embedded emitters mark the crystal’s shape and boundaries. (e) Super-resolution image of 11197 molecules between 382 THz and 385 THz, i.e., the turquoise region in (a). (f) Distribution of frequency detuning and distance between molecular pairs for emitters with less than 150 nm lateral separation.

