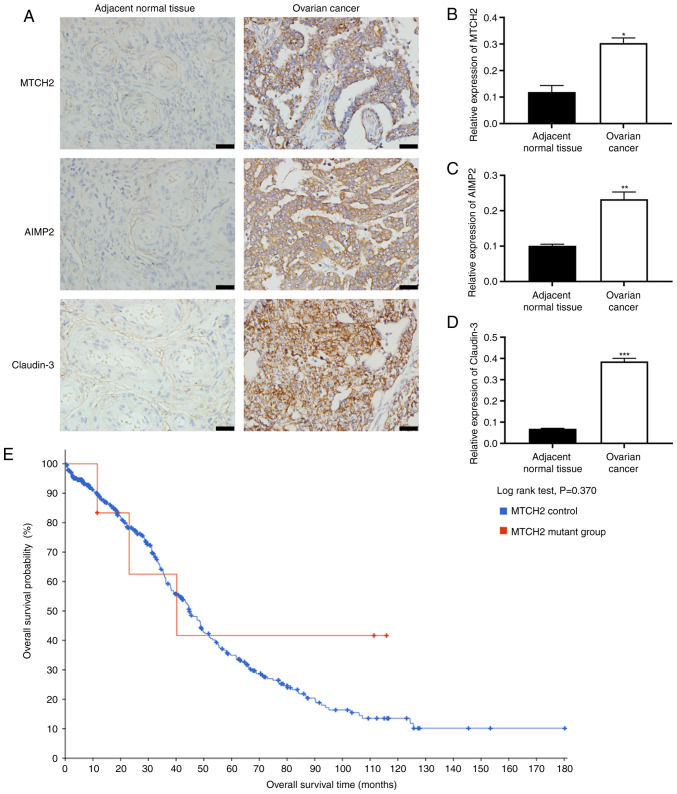
Figure 1.
Increased expression levels of MTCH2, AIMP2 and claudin-3 in OC tissue samples. (A) Representative images of immunohistochemical staining of MTCH2, AIMP2 and claudin-3 expression in OC and adjacent normal tissue samples. Scale bar, 40 µm; magnification, 400×. Quantification of the relative expression levels of (B) MTCH2, (C) AIMP2 and (D) claudin-3 in OC and adjacent normal tissue samples. (E) Data from cBioPortal was used to assess the association between MTCH2 control and MTCH2 mutant groups and the overall survival time of patients with OC. *P<0.05, **P<0.01, ***P<0.001. OC, ovarian cancer; MTCH2, mitochondrial carrier homology 2; AIMP2, aminoacyl transfer RNA synthetase-interacting multifunctional protein 2.

