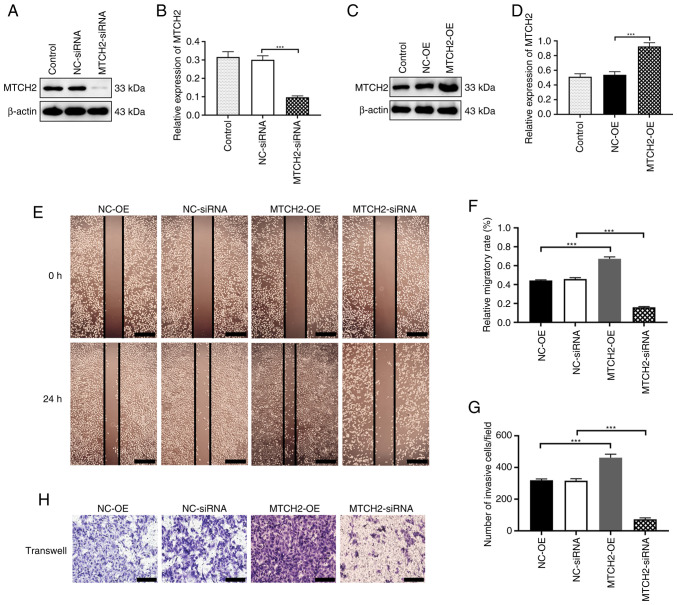
Figure 2.
MTCH2 effects on cell invasion and migration of SK-OV-3 cells. (A) Representative western blot images and (B) quantification of the validation of MTCH2 siRNA transfection efficiency. (C) Representative western blot images and (D) quantification of the validation of MTCH2-OE transfection efficiency. (E) Representative wound healing assay images of cell migration following knockdown or overexpression of MTCH2 in SK-OV-3 cells and (F) quantification or the relative migratory rate. Scale bar, 400 µm; magnification, 400×. (G) Quantification of the number of invasive cells per field of view and (H) representative Transwell assay images of cell migration following knockdown or overexpression of MTCH2 in SK-OV-3 cells. Scale bar, 100 µm; magnification, 200×. ***P<0.001. MTCH2, mitochondrial carrier homology 2; AIMP2, aminoacyl transfer RNA synthetase-interacting multifunctional protein 2; OE, overexpression; NC, negative control; siRNA, small interfering RNA.

