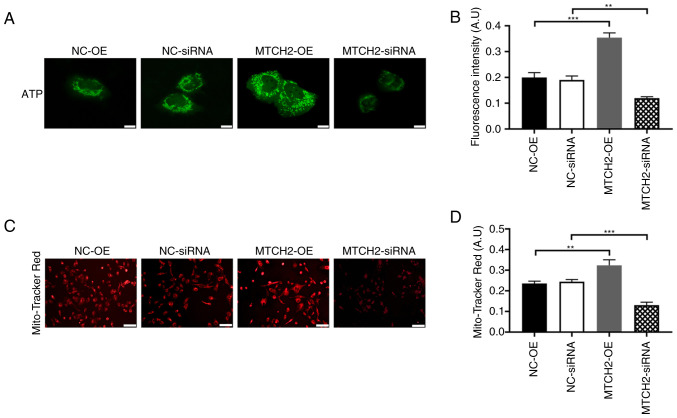
Figure 3.
MTCH2 knockdown and overexpression effects mitochondrial function and ATP production in SK-OV-3 cells. (A) Representative images of the ATP fluorescence probe assay in SK-OV-3 cells, indicating ATP production of cells following MTCH2 knockdown or overexpression and (B) quantification of the relative fluorescent intensities. Scale bar, 40 µm; magnification, 400×. (C) Representative images of mitochondrial red fluorescence which indicated mitochondrial function cell following knockdown or overexpression of MTCH2 in SK-OV-3 cells. Scale bar, 100 µm; magnification, 200×. (D) Quantification of the mitochondrial red fluorescence intensities. **P<0.01 and ***P<0.001. MTCH2, mitochondrial carrier homology 2; AIMP2, aminoacyl transfer RNA synthetase-interacting multifunctional protein 2; OE, overexpression; NC, negative control.

