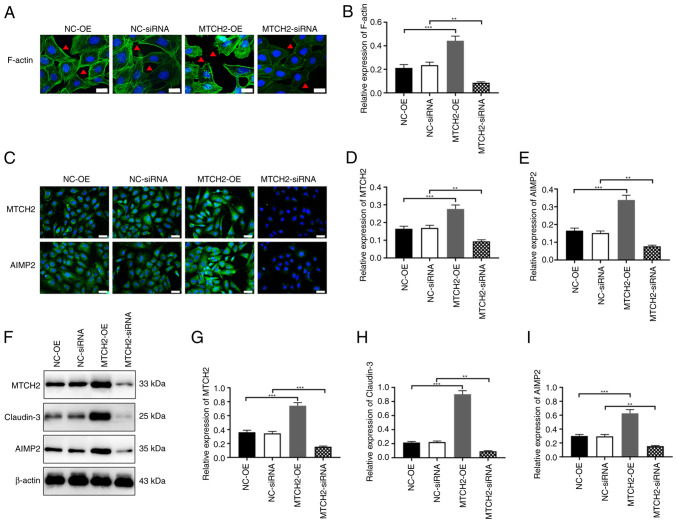
Figure 5.
MTCH2 regulated cytoskeletal remodeling and expression levels of claudin-3 and AIMP2. (A and B) Representative images of the cytoskeleton assay to evaluate the expression of F-actin in SK-OV-3 cells following knockdown or overexpression of MTCH2. The red triangle indicates changes in pseudopodia. Scale bar, 20 µm, magnification, 400×. (C-E) Representative immunofluorescent images to assess the expression levels of MTCH2 and AIMP2 following knockdown or overexpression of MTCH2. Scale bar, 40 µm; magnification, 400×. (F-I) Western blots to assess the expression levels of MTCH2, claudin-3 and AIMP2 in SK-OV-3 cells following knockdown or overexpression of MTCH2. **P<0.01 and ***P<0.001. MTCH2, mitochondrial carrier homology 2; AIMP2, aminoacyl transfer RNA synthetase-interacting multifunctional protein 2; OE, overexpression; NC, negative control.

