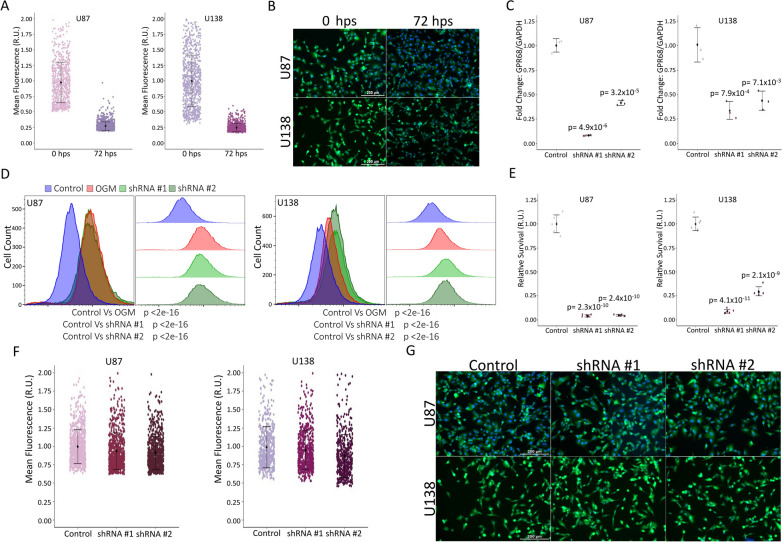
Fig. 1.
shRNA mediated ferroptosis does not inhibit dye uptake. A Stained U87 cells immediately after staining (n = 762) show more variability than at 72 h post stain (hps) (n = 1311). This pattern is recapitulated by U138 cells at 0 hps (n = 841) and 72 hps (n = 861). Data aggregated from n > 6 repeats. B Representative images of U87 and U138 cells at 0 hps and 72 hps (10 × magnification). C qRT-PCR shows significant knockdown of GPR68 mediated by shRNAs in U87 and U138 cells (n = 3 biological repeats). D Flow cytometry using Liperfluo demonstrates a significant increase in lipid peroxides with shRNA mediated knockdown of GPR68. This is consistent with the 2 µM OGM positive control in both U87 and U138 cells (n = 30,000 events). E Representative graph of CellTiter-Glo mediated assessment of cell survival 3 days post-transfection of U87s and U138s (n = 6 technical repeats; n = 3 biological repeats). F Stained shRNA #1 (n = 754) and shRNA #2 (n = 796) cells show no significant change in dye uptake from control shRNA treated U87 cells (n = 765). U138 cells recapitulate this data with shRNA #1 (n = 575) and shRNA #2 (n = 491) cells showing no significant change in dye uptake from control shRNA (n = 487). (Data aggregated from n > 6 repeats). G Representative images of control shRNA, shRNA #1, or shRNA #2 transfected U87 and U138 cells (10 × magnification). A, E, and F are relative units (R.U.). A Is normalized to 0 hps. C, E, and F are normalized to control shRNA. C, D, E Multiple two-tailed, equal variance, t-tests. A, C, E, and F mean ± SD C Bonferroni Correction of α-level of 0.05 is p < 0.025 and 0.01 is p < 0.005. D Bonferroni Correction of α-level of 0.001 is p < 0.00033. E Bonferroni Correction of α-level of 0.001 is p < 0.0005

