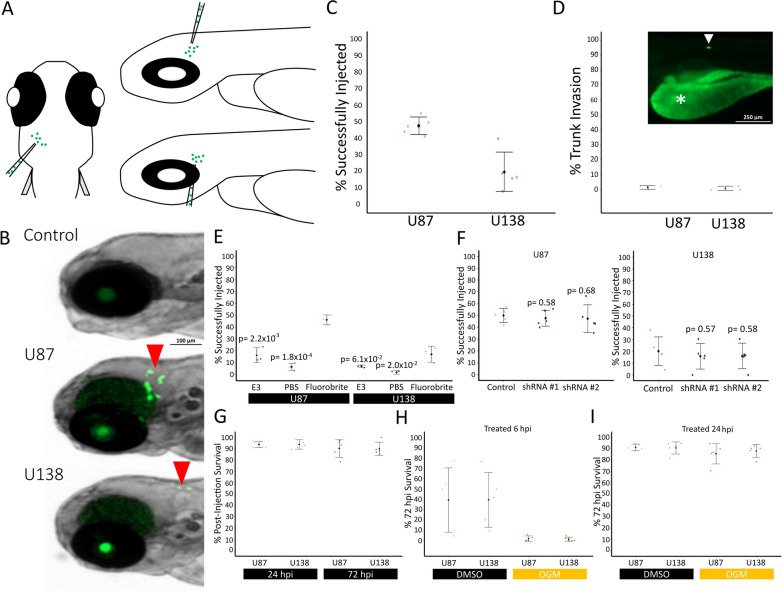
Fig. 2.
U87 and U138 cells successfully xenograft in zebrafish in the forebrain-midbrain region. A Cartoon of injection strategy. B Representative samples were injected with stained cells 24 hpi. Red arrows indicate successfully xenografted Green CMFDA labeled cells (2.5× magnification). C Xenograft success rates at 72 h post injection (hpi) (U87: n = 246; U138: n = 285; Data aggregated from n = 5 repeats). D Migration of cells from brain into trunk tissues by 72 hpi (U87: n = 132; U138: n = 109; Data aggregated from n = 3 repeats; 4 × magnification). An example photo is trunk tissues invasion at 72 hpi. * Indicates yolk, arrow indicates U138 cell. E Xenograft success rates at 24 hpi of cells resuspended and injected in E3 (U87: n = 126; U138: n = 117), PBS (U87: n = 120; U138: n = 113), or FluoroBrite media (U87: n = 132; U138: n = 109) (Data aggregated from n = 3 repeats). F No difference in xenograft success rates between control (U87: n = 324; U138: n = 339), shRNA #1 (U87: n = 209; U138: n = 249), or shRNA #2 (U87: n = 239; U138: n = 220) transfected cells at 24 hpi was observed in U87 or U138 cells (Data aggregated from n = 5 repeats). G Injections of labeled cells did not affect acute (24 hpi) or short-term survival (72 hpi) of zebrafish (U87: n = 157; U138: n = 148; Data aggregated from n = 5 repeats). H Zebrafish injected with labeled cells and treated 6 hpi with DMSO (U87: n = 153; U138: n = 159) or OGM (U87: n = 162; U138: n = 175) show a significant decrease in survival. (Data aggregated from n = 5 repeats). I Treatment of zebrafish injected with labeled cells at 24 hpi with DMSO (U87: n = 151; U138: n = 151) or OGM (U87: n = 160; U138: n = 166) did not impact zebrafish survival. (Data aggregated from n = 5 repeats). C–I mean ± SD. E and F Multiple two-tailed, equal variance, t-tests; Bonferroni Correction of α-level of 0.05 is p < 0.025, 0.01 is p < 0.005, and 0.001 is p < 0.0005

