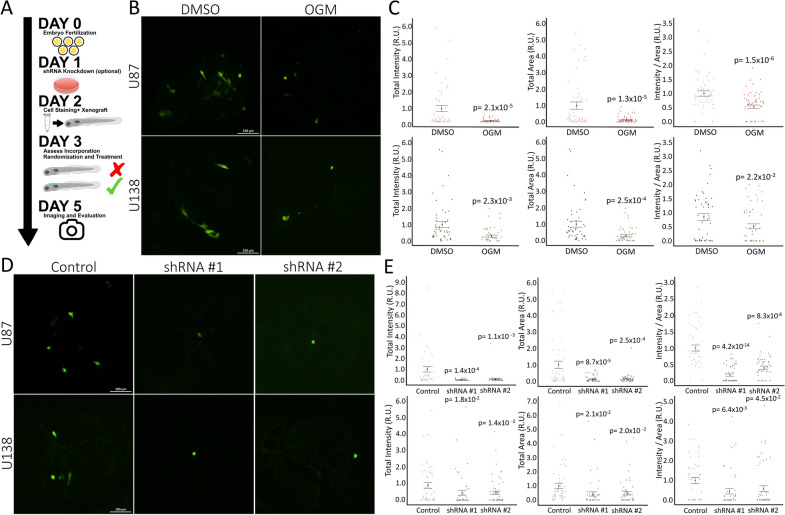
Fig. 3.
Knockdown of GPR68 inhibit U87 and U138 Xenografts growth in zebrafish. A Schematic of xenograft testing in zebrafish. B Representative confocal (flattened z-stack) images of zebrafish head 72 hpi in 5 days post fertilization (dpf) zebrafish of DMSO or 2 µM OGM treated embryos (20× magnification). C The total fluorescent intensity and total area of Green CMFDA labeled cells in the zebrafish brain at 72 hpi treated with DMSO (U87: n = 50; U138: n = 62) or 2 µM OGM (U87: n = 51; U138: n = 54) is significantly decreased for U87 (Top) and U138 (bottom) cells. The ratio of intensity/area is also significantly decreased (Data aggregated from n = 5 repeats). D Representative confocal (flattened z-stack) images of zebrafish head 72 hpi in 5 dpf injected with control, shRNA #1, or shRNA #2 transfected cells (20 × magnification). E The total fluorescent intensity, total area, and ratio of intensity/area of Green CMFDA labeled cells in the zebrafish brain at 72 hpi transfected with shRNA #1 (U87: n = 55; U138: n = 51) or shRNA #2 (U87: n = 51; U138: n = 57) is significantly decreased for U87 (Top) and U138 (bottom) cells when compared to the control shRNA (U87: n = 50; U138: n = 50) (Data aggregated from n = 5 repeats). C and E mean ± SEM. C and E are relative units (R.U.). C Is normalized to DMSO control and E is normalized to control shRNA. C Two-tailed, equal variance, t-tests. E Multiple two-tailed, equal variance, t-tests; Bonferroni Correction of α-level of 0.05 is p < 0.025, 0.01 is p < 0.005, and 0.001 is p < 0.0005

