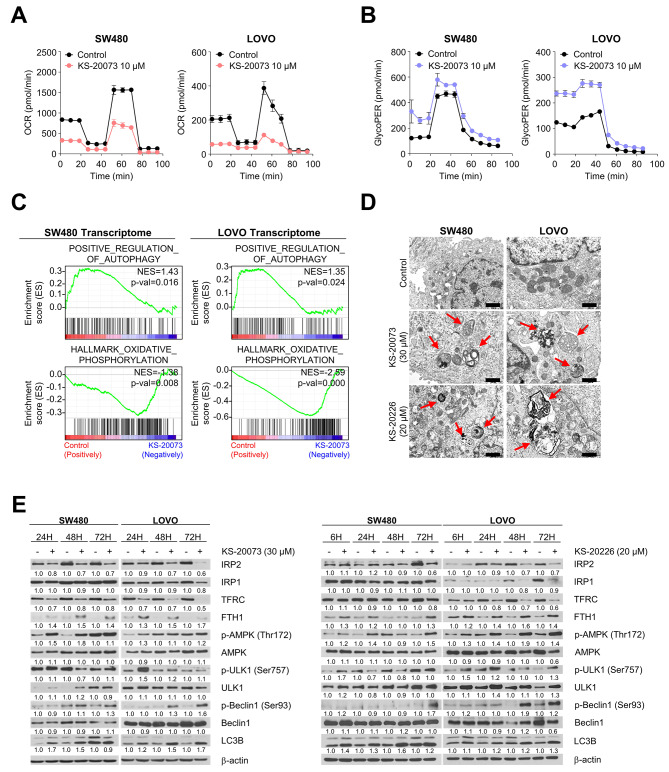
Fig. 5.
Silencing IRP2 leads to sequential reprogramming of mitochondrial metabolism and autophagy. (A) Effects of KS-20073 (10 µM) on oxygen consumption rate (OCR). Data are represented as the mean ± SEM (n = 3). (B) Effects of KS-20073 (10 µM) on glycolysis. Data are represented as the mean ± SEM (n = 3). (C) GSEA plots with selected genes are shown. GSEA showing an overrepresentation of the “POSITIVE REGULATION OF AUTOPHAGY”, underrepresentation of the “OXIDATIVE PHOSPHORYLATION”. (D) Representative transmission electron microscopy (TEM) images of IRP2 inhibitors (KS-20073; 30 µM and KS-20226; 20 µM) for 48 h. The red arrowheads indicate the autophagosomes. Scale bars in figures are 2000 nm. (E) Time-dependent expression of autophagy related proteins by KS-20073 (30 µM) and KS-20226 (20 µM). Relative protein levels were calculated using the Image J software

