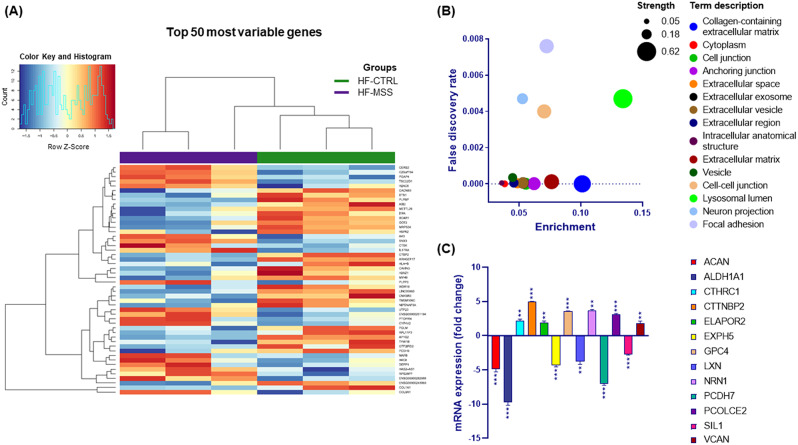
Fig. 1.
Differentially expressed genes in fibroblasts from an MSS patient compared with a healthy control. A) Heat map of the modulated genes. The heatmap shows the top 50 most variable genes based on the logFC value. Upregulated genes are reddish while downregulated genes are in blueish as reported in the colour key histogram. Control and patient fibroblast samples are indicated by a green and violet bar respectively. Gene names are indicated on the right. (B) Bubble plot of cellular components enriched by differentially expressed genes. Enrichment is calculated as the ratio of the number of observed genes to the total number of genes associated with that specific ontology. The strength represents the Log10 of the ratio between the number of genes annotated to a specific ontology and the number of genes expected to be annotated to that ontology if they were picked randomly from a group of the same size. (C) Quantitative PCR analysis. Twelve differentially expressed genes identified by transcriptomic analysis were validated by quantitative reverse transcriptase PCR. Data are expressed as fold change and gene names are in the legend shown on the right. One-way ANOVA was performed to compare ΔCt values. ** p > 0.01, *** p > 0.001. Results are presented as mean ± standard error of fold changes from three independent experiments performed in technical triplicate

