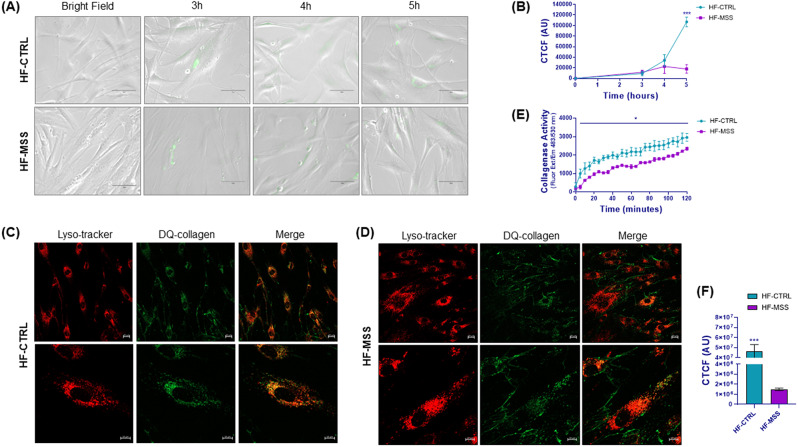
Fig. 2.
Live cell imaging of DQ-collagen internalization in fibroblasts and collagenase activity. (A) Panels show representative images of DQ-collagen fluorescence internalised in control (HF-CTRL) and patient fibroblasts (HF-MSS) over time. (B) Quantitation of the fluorescence of the experiment shown in A. The y axis represents the corrected total cell fluorescence (CTCF) expressed as arbitrary units. Results are presented as mean ± standard error from three independent experiments. Repeated measure ANOVA over time points and post parametric multiple t test were performed; *** p < 0.001q < 0.001. (C-D) Control fibroblasts (HF-CTRL in C) and patient fibroblasts (HF-MSS in D) grown on ibidi µ-slide were incubated with DQ-collagen for 5 h, followed by LysoTracker for 3 h. Live cells were imaged by confocal microscope using the 495 and 647-nm lasers. LysoTracker and DQ-collagen fluorescence are shown in red and green respectively. Colocalization of lysosomes and DQ-collagen is shown by merging the fluorescence. Two different magnifications are shown. Results are from two independent experiments performed in technical triplicate. (E) Collagenase activity of fibroblast conditioned medium. Cell-free supernatants of fibroblasts were incubated with DQ-collagen and fluorescence development was measured every 5 min. Results are presented as mean ± standard error from two independent experiments performed in technical triplicate. Repeated measure ANOVA over time points and post parametric multiple t test were performed; * P < 0.05. (F) The graph shows the quantification of internalized collagen in HF-CTRL and HF-MSS of the experiments shown in C and D. *** P < 0.001

