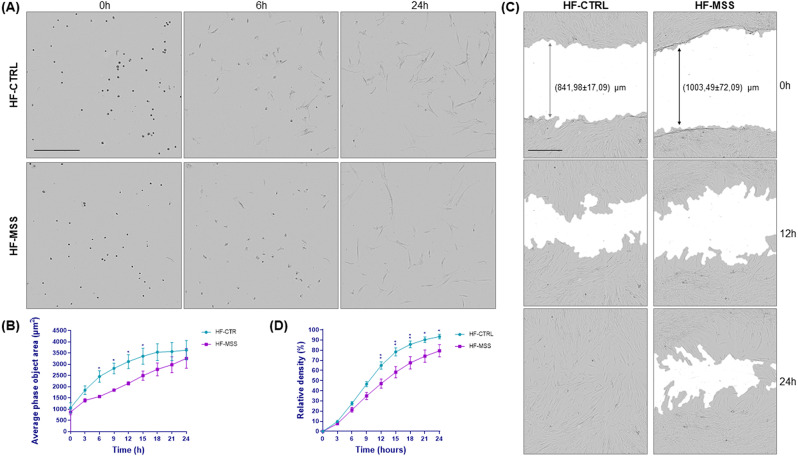
Fig. 4.
Analysis of fibroblast-ECM interactions. (A) Fibroblast attachment rate. Control (HF-CTRL) and patient fibroblasts (HF-MSS) were plated on a 96 well plate and imaged immediately after and then every three hours for 24 h. Images are shown at 0, 6 and 24 h of incubation as indicated. Differences in attachment rate are already visible after 6 h. Scale bar is 400 μm. (B) Graph shows the area occupied by the cells over time. Results are presented as mean ± standard error from three independent experiments performed in technical quadruplicate. Repeated measure ANOVA over time points and post parametric multiple t test were performed; * p < 0.05. (C) Wound-healing assay. Control (HF-CTRL) and patient fibroblasts (HF-MSS) plated at confluency on a 96 well plate were scratched and wound closure was imaged every three hours for 24 h. Images show differences in cell migration at 0 h, 12 h and 24 h of incubation. Scale bar is 400 μm (D) Quantitative analysis of the experiment shown in B. Cell migration is expressed as relative wound density. Results are presented as mean ± standard error from four independent experiments performed in technical quadruplicate. Repeated measure ANOVA over time points and post parametric multiple t test were performed; * p < 0.05, **p < 0.01

