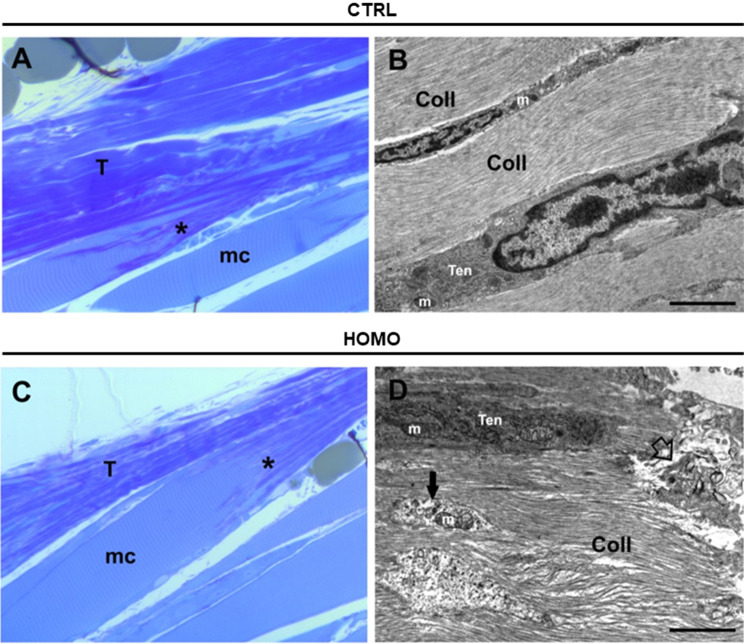
Fig. 5.
Light and transmission electron microscopy (TEM) analysis of Achilles tendons of control and woozy mouse. (A and C) Toluidine blue stained semi thin-sections of the boundary between Achilles tendon (T) and the soleus muscle (mc) from heterozygous (SIL1+/−) control (CTRL, A) and woozy (SIL1−/−) mice (HOMO, C). The myotendinous junction (MTJ) is indicated by asterisk. (B and D) Representative images at TEM higher magnification of the connective tissue in control (CTRL, B) and woozy mice (HOMO, D), with tenocytes (Ten) arranged between the collagenous fibrils (Coll) of the ECM. Some organelles are visible (e.g. mitochondria, m) as well as cell debris (black arrow), and areas of degeneration (empty arrow)

