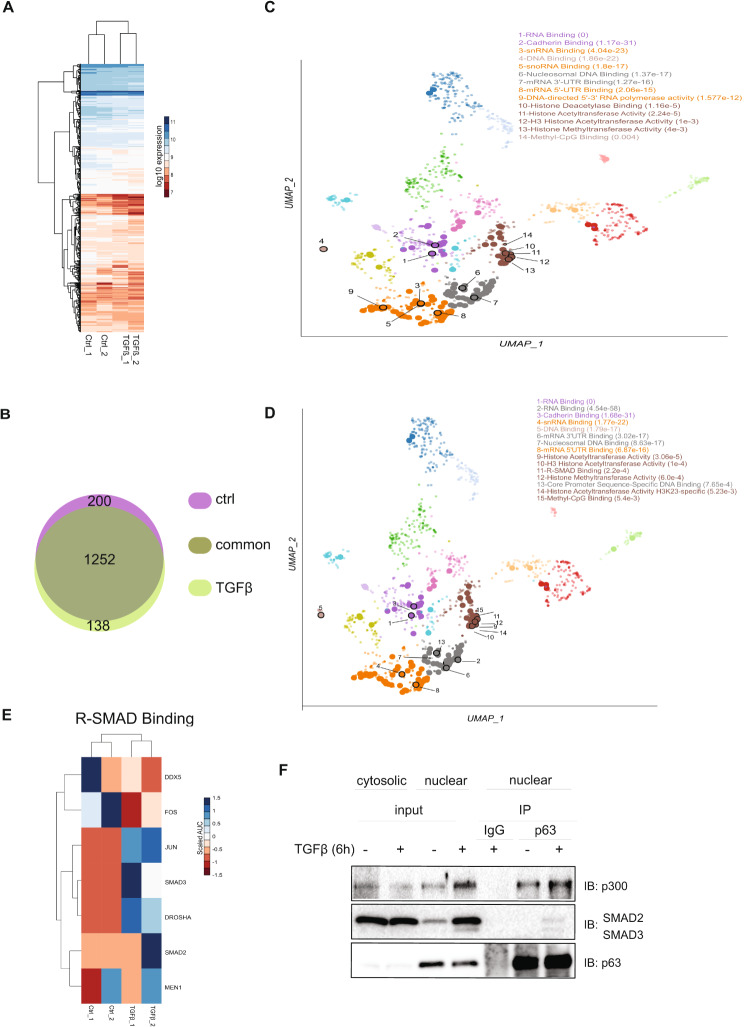
Fig. 4.
Identification of ΔNp63-interacting proteins. (A) Heatmap showing the peptide intensities derived from the MS/MS spectrum for control samples (Ctrl) and TGFβ-treated samples. Log10 expression represents peptide intensities derived from quantifying area under curve (AUC) of significantly enriched peaks. (B) Illustration of the number of the identified p63 interactors, enriched in both control condition and TGFβ-treated condition (common), uniquely enriched in control condition (control) or uniquely enriched in TGFβ-treated condition (TGFβ). C, D UMAP plots visualizing the most significantly enriched molecular functions derived from the gene ontology database and associated with proteins identified in control samples (C) and TGFβ-treated samples (D). (E) Heatmap depicting the intensity patterns of proteins involved in R-SMAD binding in the respective samples. Scaled AUC was calculated using Z-score method representing quantified AUC of peptide intensities. (F) p63 interaction with p300 and SMAD2/3. MCF10A MII cells, starved in 0.2% FBS medium and stimulated with TGFβ or not for 6 h, were subjected to nuclear-cytosolic fractionation. The nuclear lysates (input nuclear) were immunoprecipitated (IP) with p63-specific antibody, or IgG control, and analyzed by immunoblotting utilizing specific antibodies, as indicated. One of three independent experiments with similar results, is shown

