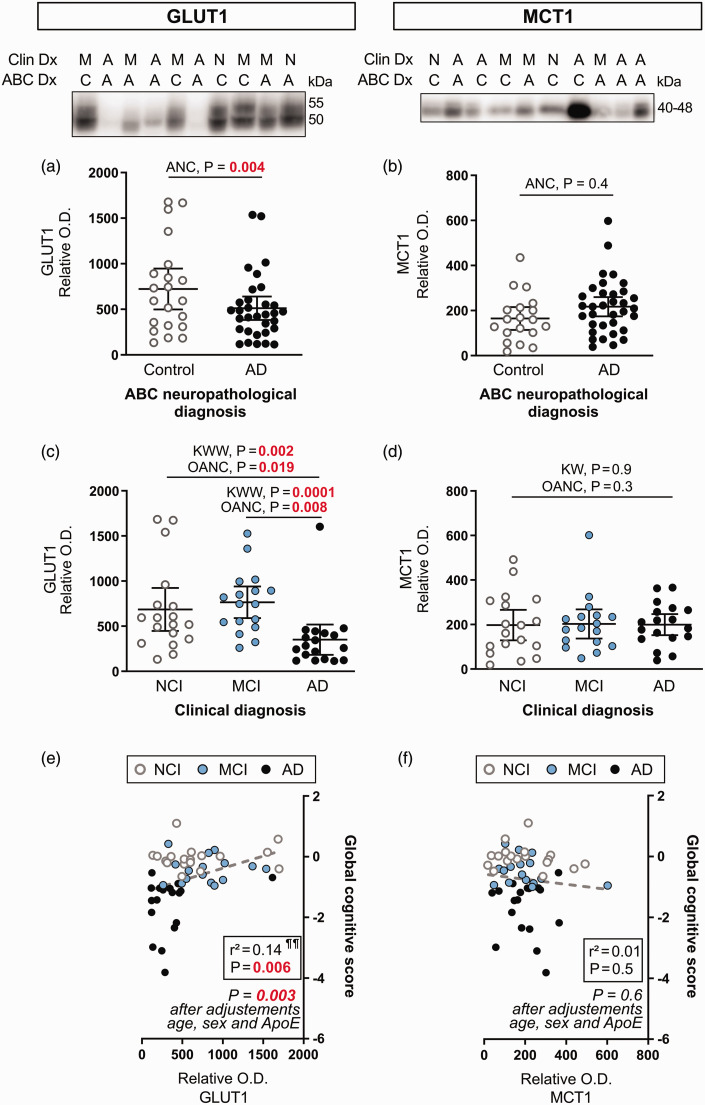
Figure 2.
Cerebrovascular levels of GLUT1 are lower in clinically diagnosed AD participants, while MCT1 levels are comparable between subjects. (a, b) Subjects were compared according to the neuropathological diagnosis following ABC criteria. (c, d) Subjects were grouped according to the clinical diagnosis. Protein content in human microvessel extracts were determined by Western immunoblotting. Data are represented as scatterplots, with horizontal lines depicting means of relative optical density values with 95% confidence intervals. Representative photo examples illustrate consecutive bands. Uncropped gels of all immunoblot assays are shown in Suppl. Fig. 1. (e,f) GLUT1 was positively associated with global cognitive scores, but not MCT1.
Statistical analysis: (a, b) Analysis of covariance F-test with sex, age at death and ApoE genotype as covariates (ANC). GLUT1 and MCT1 outliers were removed from statistical analyses (ROUT test Q=1%). (c, d) Kruskall-Wallis one-way analysis of ranks followed Continued.by a Wilcoxon’s post hoc test (KWW), One-Way Analysis of covariance F-test with sex, age at death and ApoE genotype as covariates (OANC). GLUT1 and MCT1 outliers were removed from statistical analyses (one in each group, ROUT test Q = 1%). Additional statistical analyses are available in Suppl. Table 2. (e, f) Linear regressions adjusted for the following covariates: gender, age at death and APOE genotype. Coefficients of determination (r2) are shown.
Abbreviations: ABC, Dx Neuropathological Diagnosis; A-AD, Alzheimer’s disease; ANC, Analysis of covariance; C, Control; Clin Dx, Clinical Diagnosis; GLUT1, Glucose transporter 1; KWW, Kruskall-Wallis followed by Wilcoxon's test; M-MCI, Mild cognitive impairment; MCT1, Monocarboxylate transporter 1; N-NCI, Healthy controls with no cognitive impairment; OANC, One-way analysis of covariance; O.D., Optical density.

