
Figure 1.
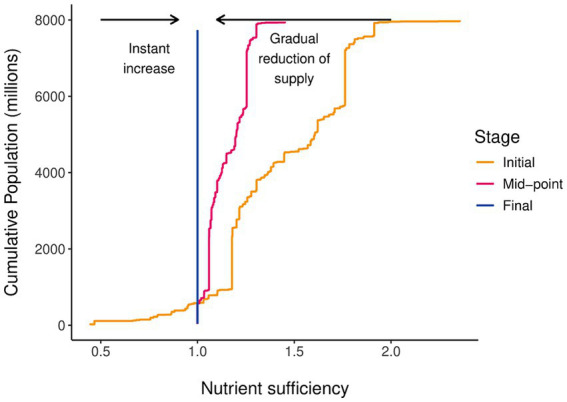
Conceptual diagram of nutrient distribution and re-distribution across the global population. Colors and linetype represent the stage of supply reduction and text labels, and arrows indicate the direction of increase or decrease.
Official websites use .gov
A
.gov website belongs to an official
government organization in the United States.
Secure .gov websites use HTTPS
A lock (
) or https:// means you've safely
connected to the .gov website. Share sensitive
information only on official, secure websites.
Conceptual diagram of nutrient distribution and re-distribution across the global population. Colors and linetype represent the stage of supply reduction and text labels, and arrows indicate the direction of increase or decrease.