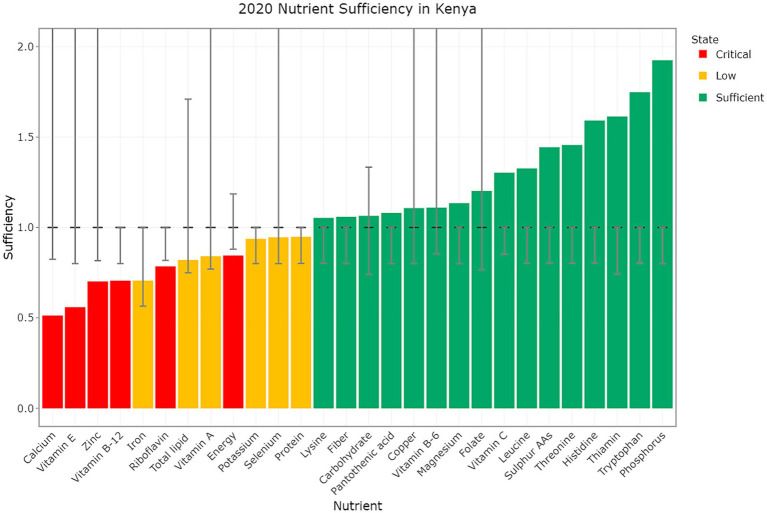
Figure 3.
Nutrient sufficiency in Kenya for the Year 2020. The bars represent the level of sufficiency, while the dashed black line indicates the threshold for nutrient sufficiency based on PRI. The lower limit is either the EAR if this is available or 20% below the target if not. Error bars denote upper and lower limits where applicable, and colors signify different states of sufficiency with values below the lower limit shown as critical (red), values between the lower limit and the target as low (gold), and values at or above the target as sufficient (green). Upper limits are only shown where these fit within the y-axis bounds.

