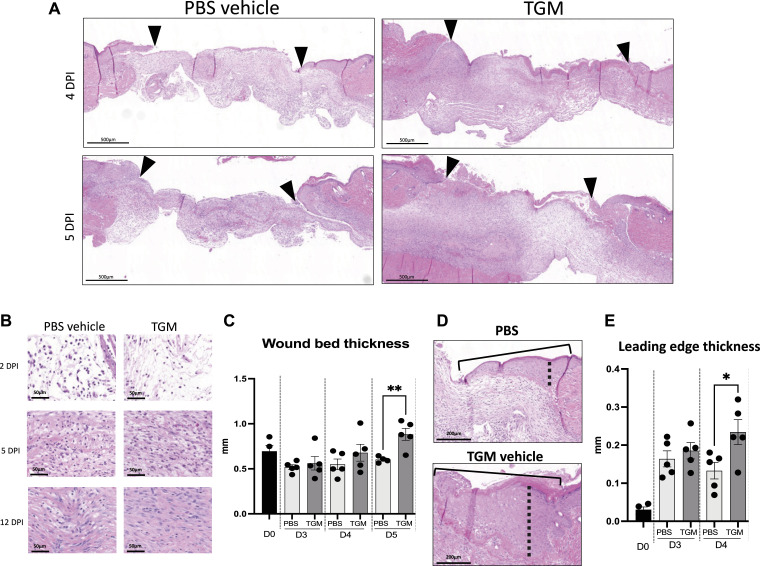
Figure 2. TGF-β mimic (TGM) enhances the granulation development and thickness of the epidermis/dermis within the newly formed wound.
(A) Representative hematoxylin and eosin (H&E) stained images on days 4 and 5 post-injury. Eosin staining was used to identify granulation tissue formation within the wound beds (marked by arrows) of the TGM and PBS vehicle control wounds at each timepoint. (B) Representative H&E images at higher magnification (20x) were used to visually assess the cellular and extracellular matrix deposition within the wound beds of PBS vehicle control and TGM-treated wounds on days 2, 5, and 12 post-injury. (C) H&E stained wounds were used to measure the wound thickness of the treatment groups on days 3, 4, and 5 post-injury. (A) Blinded analysis in ImageJ was used to measure the thickness of the granulation tissue within the wound bed (area between the black arrows in (A)). Multiple lengths obtained from one wound bed were averaged. Results from two or more independent determinations demonstrated similar results (**P < 0.01; five biologically independent samples were used per treatment for the blinded analysis on ImageJ). (D) Representative H&E images of the wound edge, marked by the solid black line, were used to measure wound edge thickness. Blinded analysis in ImageJ was used to measure the thickness of the wound edge. The dotted black line indicates the length measured. (E) H&E stained images were used to measure the thickness of the leading edge within the wound bed. Measurements for PBS vehicle control and TGM were analyzed on days 0, 3, and 4. The thickest part of the wound edge over the granulation tissue was used for the analysis. Results of two or more independent determinations demonstrated similar results (**P < 0.05; five biologically independent samples were used per treatment for the blinded analysis on ImageJ). (C, E) Statistical analysis was performed using a t test (C, E) to compare the two treatments at each time point. Error bars represent mean ± SEM.

