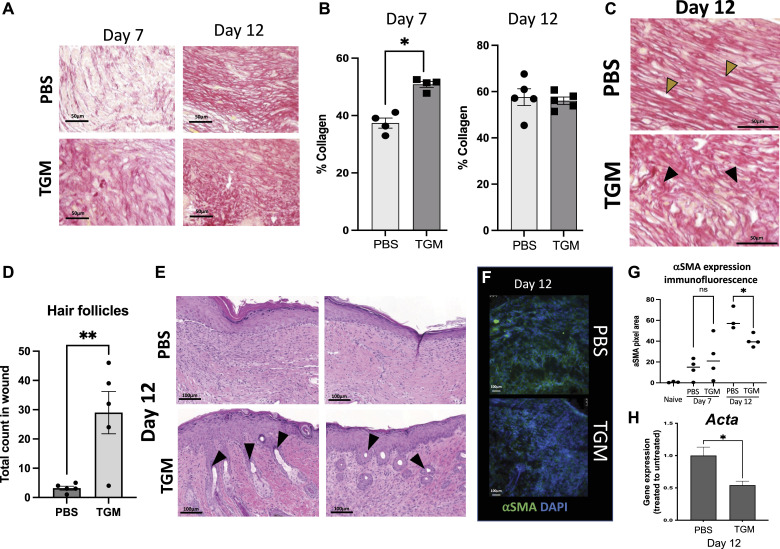
Figure 3. TGF-β mimic-treated wounds are associated with pro-regenerative collagen deposition and orientation, enhanced hair follicle frequency and regulated myofibroblast expression.
(A) Picrosirius red stain was used to identify the orientation and quantify the percentage of collagen within the newly formed wound bed. Representative images of picrosirius red stain for collagen quantification (20x) identify the amount of collagen in the two treatments on days 7 and 12. (B) The collagen area within the 20x picrosirius red-stained slides was quantified using the MRI Fibrosis Tool plugin on ImageJ. Multiple images were taken for each sample spanning the length of the wound bed and then averaged for that sample. Results from two or more independent determinations demonstrated similar results (**P < 0.01; five biologically independent samples were used per treatment for the blinded analysis on ImageJ). Statistical analysis was performed using a t test to compare the two treatments at each time point. Error bars represent mean ± SEM. (C) Representative images of picrosirius red-stained slides on day 12 that were used to identify the collagen orientation in PBS vehicle control and TGF-β mimic treated wounds. Yellow arrows highlight examples of collagen in a parallel orientation. Black arrows highlight examples of basket weave collagen deposition. Images represent similar images among the other five samples in each treatment. (D) H&E stains were used to quantify the frequency of hair follicles within the wound beds on day 12. Hair follicles were included in the count if they were located within the wound bed and beneath the thickened epidermis which represented the area of the wound. (**P < 0.01; five biologically independent samples were used per treatment for the blinded analysis on ImageJ). A t test was performed to compare the two treatments at each time point. Error bars represent mean ± SEM. Results from two or more independent determinations demonstrated similar results. (E) Representative images of H&E stained slides from wounds on day 12 were used to identify skin maturation through the appearance of hair follicle formation within the wound bed. Black arrows = hair follicles. (F, G) Alpha smooth muscle actin (αSMA) representing myofibroblast formation, was quantified in all images on day 12 through immunostained slides. (F) Representative immunofluorescent stained images of wound beds stained with αSMA on day 12; αSMA (green fluorescent signal), DAPI (blue fluorescent signal). (G) Immunostained slides with αSMA were quantified on days 7 and 12 by the fluorescent intensity measured as pixel area using ImageJ. (*P < 0.05; five biologically independent samples were used per treatment for the blinded analysis on ImageJ). Results from two or more independent determinations demonstrated similar results. (H) Gene expression analysis of Acta2 expression was used to further analyze the αSMA expression within the wound bed on day 12 post-wound. (*P < 0.05; five biologically independent samples were used per treatment for the blinded analysis on ImageJ). Results from two or more independent determinations demonstrated similar results. (F, G) Statistical analysis was performed using a t test (F, G) to compare the two treatments at each time point. Error bars represent mean ± SEM.

