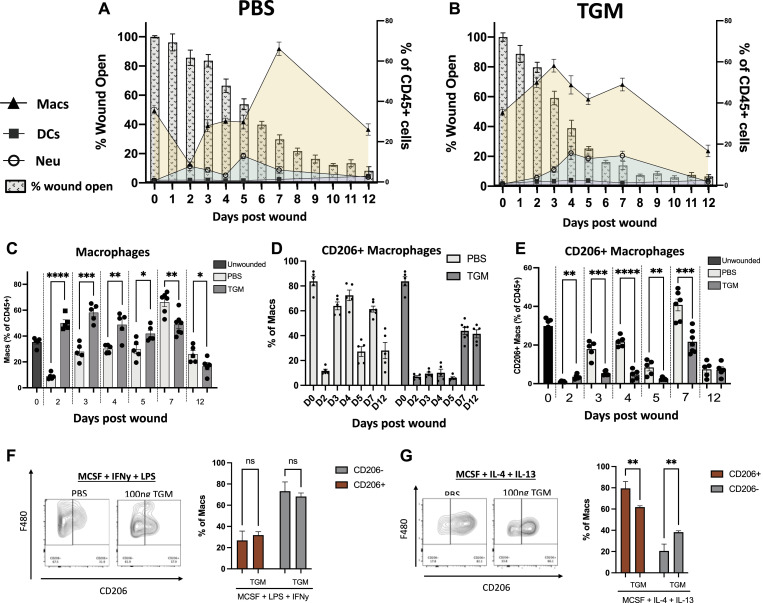
Figure 5. TGF-β mimic (TGM) treatment reprograms myeloid cell expansion and delays macrophage CD206 expression.
(A, B) Flow cytometric analysis of the cell population within the wound beds from day 0 to day 12 for PBS vehicle control (A) and TGM (B) treated wounds. The analyzed cells include macrophages (CD11b+ F480+ CD64+), dendritic cells (MHCII+ CD11c+ CD64−) and neutrophils (CD11b+ Ly6G+ CD64−) as a percentage of the total CD45+ cells. The cell populations at each time point are overlayed on a bar graph representing the wound closure of each treatment group. Left Y-axis denotes the percentage of myeloid cells of total CD45+ cells represented in the line graph. Right Y access denotes the percentage of wound open as represented in the background bar graph. The X-axis represents the days post wounding. (C) Flow cytometric analysis of the frequency of macrophages (CD11b+ F480+ CD64+), as a percentage of all CD45+ cells, in PBS vehicle control and TGM treated wounds from day 0 to day 12. (*P < 0.05, **P < 0.01, ***P < 0.001, ****P < 0.0001; five biologically independent samples were used per treatment at each time). Representative results from two or more independent experiments are shown. (D) Flow cytometric analysis for the frequency of the CD206+ macrophages as a percentage of total macrophages between PBS vehicle control and TGM treated wounds. Representative results from two or more independent experiments are shown. (E) Flow cytometric analysis of the frequency of CD206+ macrophages as a percentage of total CD45+ cells in PBS vehicle control and TGM treated wounds from day 0 to day 12. (*P < 0.05, **P < 0.01, ***P < 0.001, ****P < 0.0001; five biologically independent samples were used per treatment at each time point). Representative results from two or more independent experiments are shown. (F, G) Flow cytometric analysis of the frequency of CD206+ macrophages gated on CD11b+ F4/80+. (F, G) BMDMs were isolated and stimulated for 16 h in a (F) classically activated (LPS/IFNy) macrophage-inducing environment or (G) alternatively activated (IL-4/IL-13) macrophage environment with or without TGM. Bar graphs represent the frequency of CD206+ or CD206- macrophages as a percentage of all macrophages (*P < 0.05, **P < 0.01, ***P < 0.001, ****P < 0.0001; three wells were used per treatment). Statistical analysis of the CD206+ or CD206− populations was performed using a one-way ANOVA test with Tukey’s multiple comparisons for comparison between all treatment groups. Error bars represent mean ± SEM.

