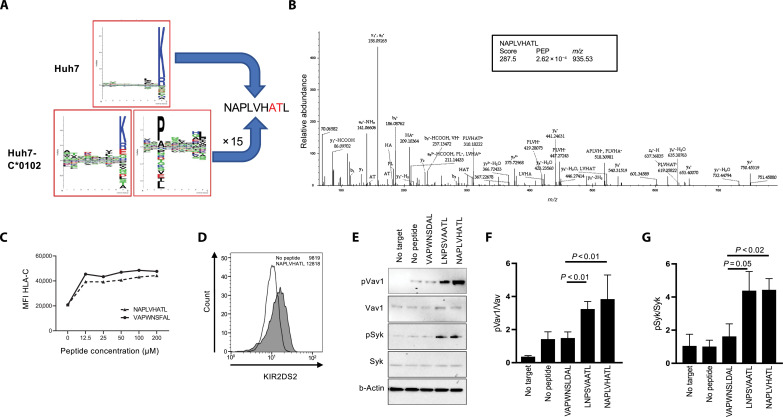
Fig. 1. An XPO1-derived peptide is a ligand for KIR2DS2.
(A) SeqLogo plots of peptides eluted from Huh7 and Huh7:HLA-C*01:02 cell lines. (B) Representative and annotated ms2 spectrum that has been assigned to the peptide sequence NAPLVHATL. The resulting Byonic score, the posterior error probability (PEP) and the mass/charge ratio (m/z) value of the singly protonated species is shown in the inset. (C) 721.174 cells were incubated with NAPLVHATL at the indicated concentrations, stained for HLA-C using the DT9 antibody, and analyzed by flow cytometry. The mean fluorescence intensity (MFI) of DT9 staining compared to the positive control VAPWNSFAL peptide is shown. (D) 721.174 cells were incubated with 100 μM NAPLVHATL peptide and stained with a KIR2DS2-tetramer and analyzed by flow cytometry. Histogram plots of KIR2DS2-staining compared with a no peptide control are shown, with median fluorescence intensities indicated. (E to G) 721.174 cells were incubated overnight with the indicated peptides at 200 μM and cocultured with NKL-2DS2 cells, and then the cells were lysed and analyzed for phosphorylation of Syk (Tyr323 and Tyr317) and Vav1 (Tyr174) by Western blotting. A representative Western blot is shown in (E); the ratios of pVav1 to Vav1 (F) and pSyk to Syk (G) from three independent experiments are also shown. P values indicate comparison of the NAPLVHATL peptide with negative (VAPWNSDAL) and positive (LNPSVAATL) control peptides as determined by one-way analysis of variance (ANOVA).

