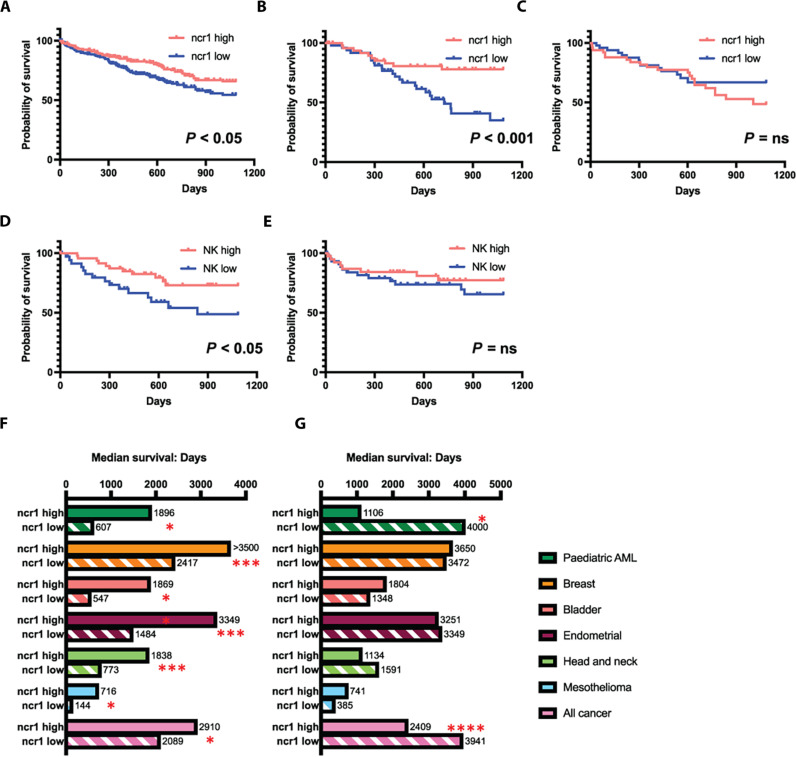
Fig. 4. The combination of high levels of XPO1 and ncr1 expression is associated with improved survival in cancer.
(A to C) Kaplan-Meier plots of HCC TCGA data comparing 3-year survival in individuals with highest (red lines) and lowest (blue lines) quartile levels of ncr1 expression in the whole cohort (A), individuals with levels of XPO1 above the median (B), and individuals with levels of XPO1 below the median (C). (D and E) show the Kaplan-Meier plots of the XPO1 high (D) and low (E) analyzed according to peripheral blood NK cell infiltration into the tumors as determined by Cibersort X analysis comparing the highest and lowest quartiles of NK cell infiltration. For all plots, P values were calculated using the log-rank Mantel-Cox test. (F and G) Median survival of individuals with high and low levels of ncr1 expression in different TCGA datasets comparing individual groups with XPO1 levels above (F) and below (G) the median value for each group. P values compare the ncr1high and ncr1low groups using the log-rank Mantel-Cox test. The following numbers of cases analyzed in each cohort were as follows: pediatric acute myeloid leukemia (AML) (187 cases), breast cancer (1098 cases), bladder cancer (412 cases), endometrial cancer (559 cases), head and neck cancer (528 cases), mesothelioma (86 cases), and all cancers (11,768 cases). *P < 0.05, **P < 0.01, ***P < 0.005, ****P < 0.0001.

