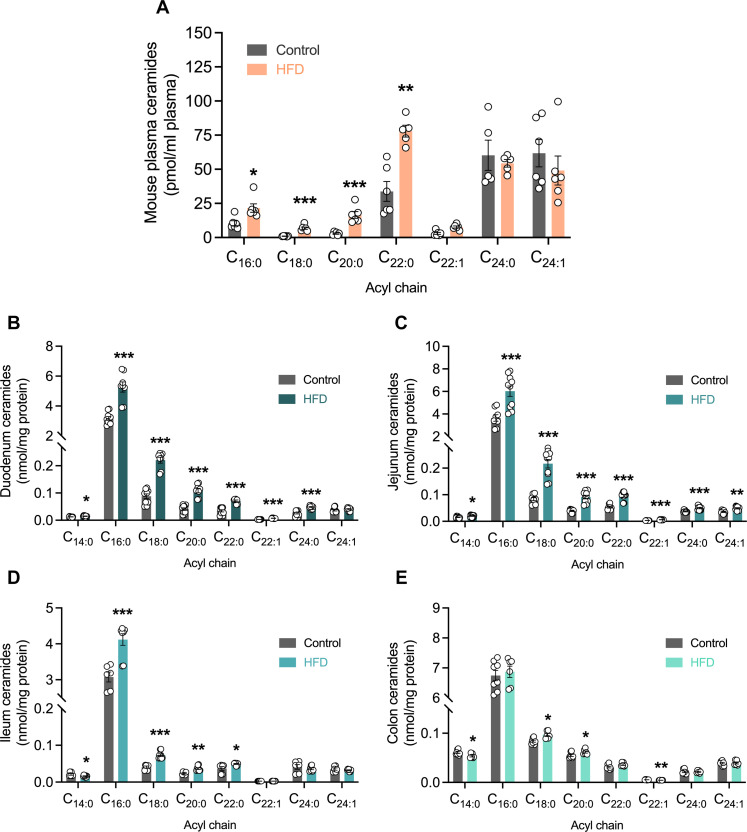
Fig. 1. Ceramides increase in the circulation and gut epithelium in response to high fat feeding.
(A) Lipidomic quantitation of individual ceramide species in plasma samples obtained after refeed from mice fed either a control or high-fat diet (HFD). n = 6. Lipidomic quantitation of individual ceramide species in isolated gut epithelial cells from the (B) duodenal, (C) jejunal, (D) ileal, and (E) colonic regions of mice fed a control or HFD. (B and C) n = 8 to 10 and (D and E) n = 6 to 8. Data are expressed as means ± SEM. *P < 0.05, **P < 0.01, and ***P < 0.001.

