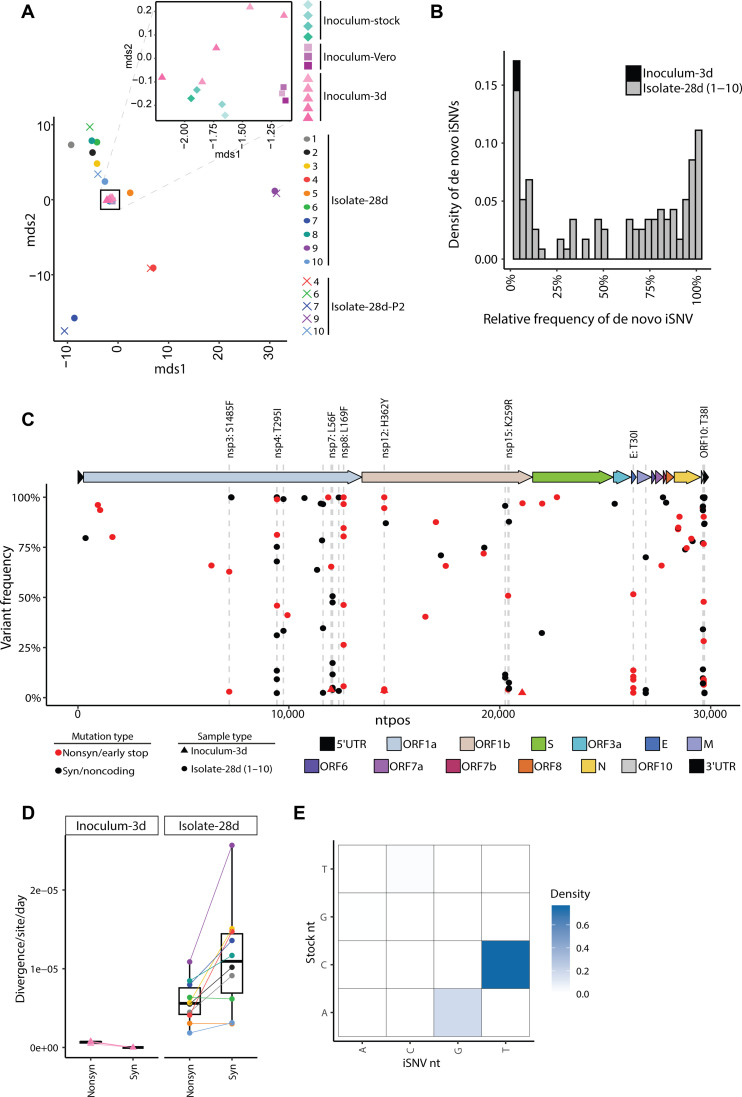
Fig. 7. Intrahost SARS-CoV-2 variants emerge during infection in tandem CD4+/CD8+ T cell–depleted mice.
(A) MDS plot of the pairwise genetic distance (L1-norm) calculations across all samples in the dataset. The inset zooms in on the black box to show the positions of the inoculum samples. Point color and shape represent the sample and collection type. For the inoculum-stock, the color gradient represents different aliquots of the stock. For inoculum-Vero and inoculum-3d, the color gradients represent different infections. (B) The frequency distribution of de novo variants identified in the inoculum-3d (black) and isolate-28d (1 to 10, gray) samples. (C) The location, frequency, and characteristics of de novo variants in the inoculum-3d (triangle) and isolate-28d (1 to 10, circle) samples. The color of each point represents the type of mutation including mutations that are synonymous/in noncoding regions (black) or nonsynonymous/stop codon mutations (red). Point shape indicates the type of sample collection. Dashed lines highlight the genomic positions where a de novo mutation was found in more than one mouse isolate-28d sample. Labels are added for the nonsynonymous substitutions only. The colors on the genome map represent the different gene regions. 5′UTR, 5′ untranslated region; ORF, open reading frame; S, spike; E, envelope; M, membrane; N, nucleocapsid; nsp, nonstructural protein. (D) The nonsynonymous and synonymous divergence rates normalized by the expected number of sites in the coding sequence for the inoculum-3d samples and T cell–depleted mouse isolate-28d samples. Point color and shape represent the sample and collection type as outlined in Fig. 7A. (E) The density of transitions and transversions for all de novo mutations (2 to 100%). nt, nucleotide.

