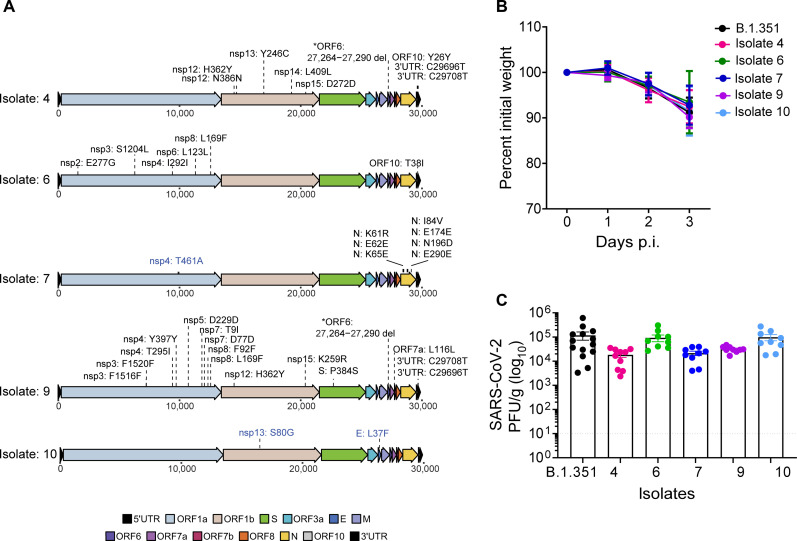
Fig. 8. De novo mutations lead to differences in virus replication.
(A) Mutation maps of de novo SARS-CoV-2 consensus mutations (≥50%) in the mouse isolates 4, 6, 7, 9, and 10 and compared to the isolate-Vero samples. Blue labels represent mutations that reached ≥50% in the isolate-Vero sample but were present at <50% in the original mouse isolate. Labels represent amino acid information for mutations in coding regions and nucleotide information for deletions or mutations in the noncoding regions of the genome. The colors on the genome map represent the different gene regions. (B) C57BL/6 mice were infected with mice isolates-P2 as indicated, and weight loss was measured over 3 days. The graph represents the percent initial weight compared to the initial weight on the day of infection. (C) Infectious virus from lungs of mice infected with indicated isolates at day 3 p.i. was quantified by plaque assay in VeroE6-ACE2-TMPRSS2 overexpressing cells and expressed as PFU per gram of lung tissue.

