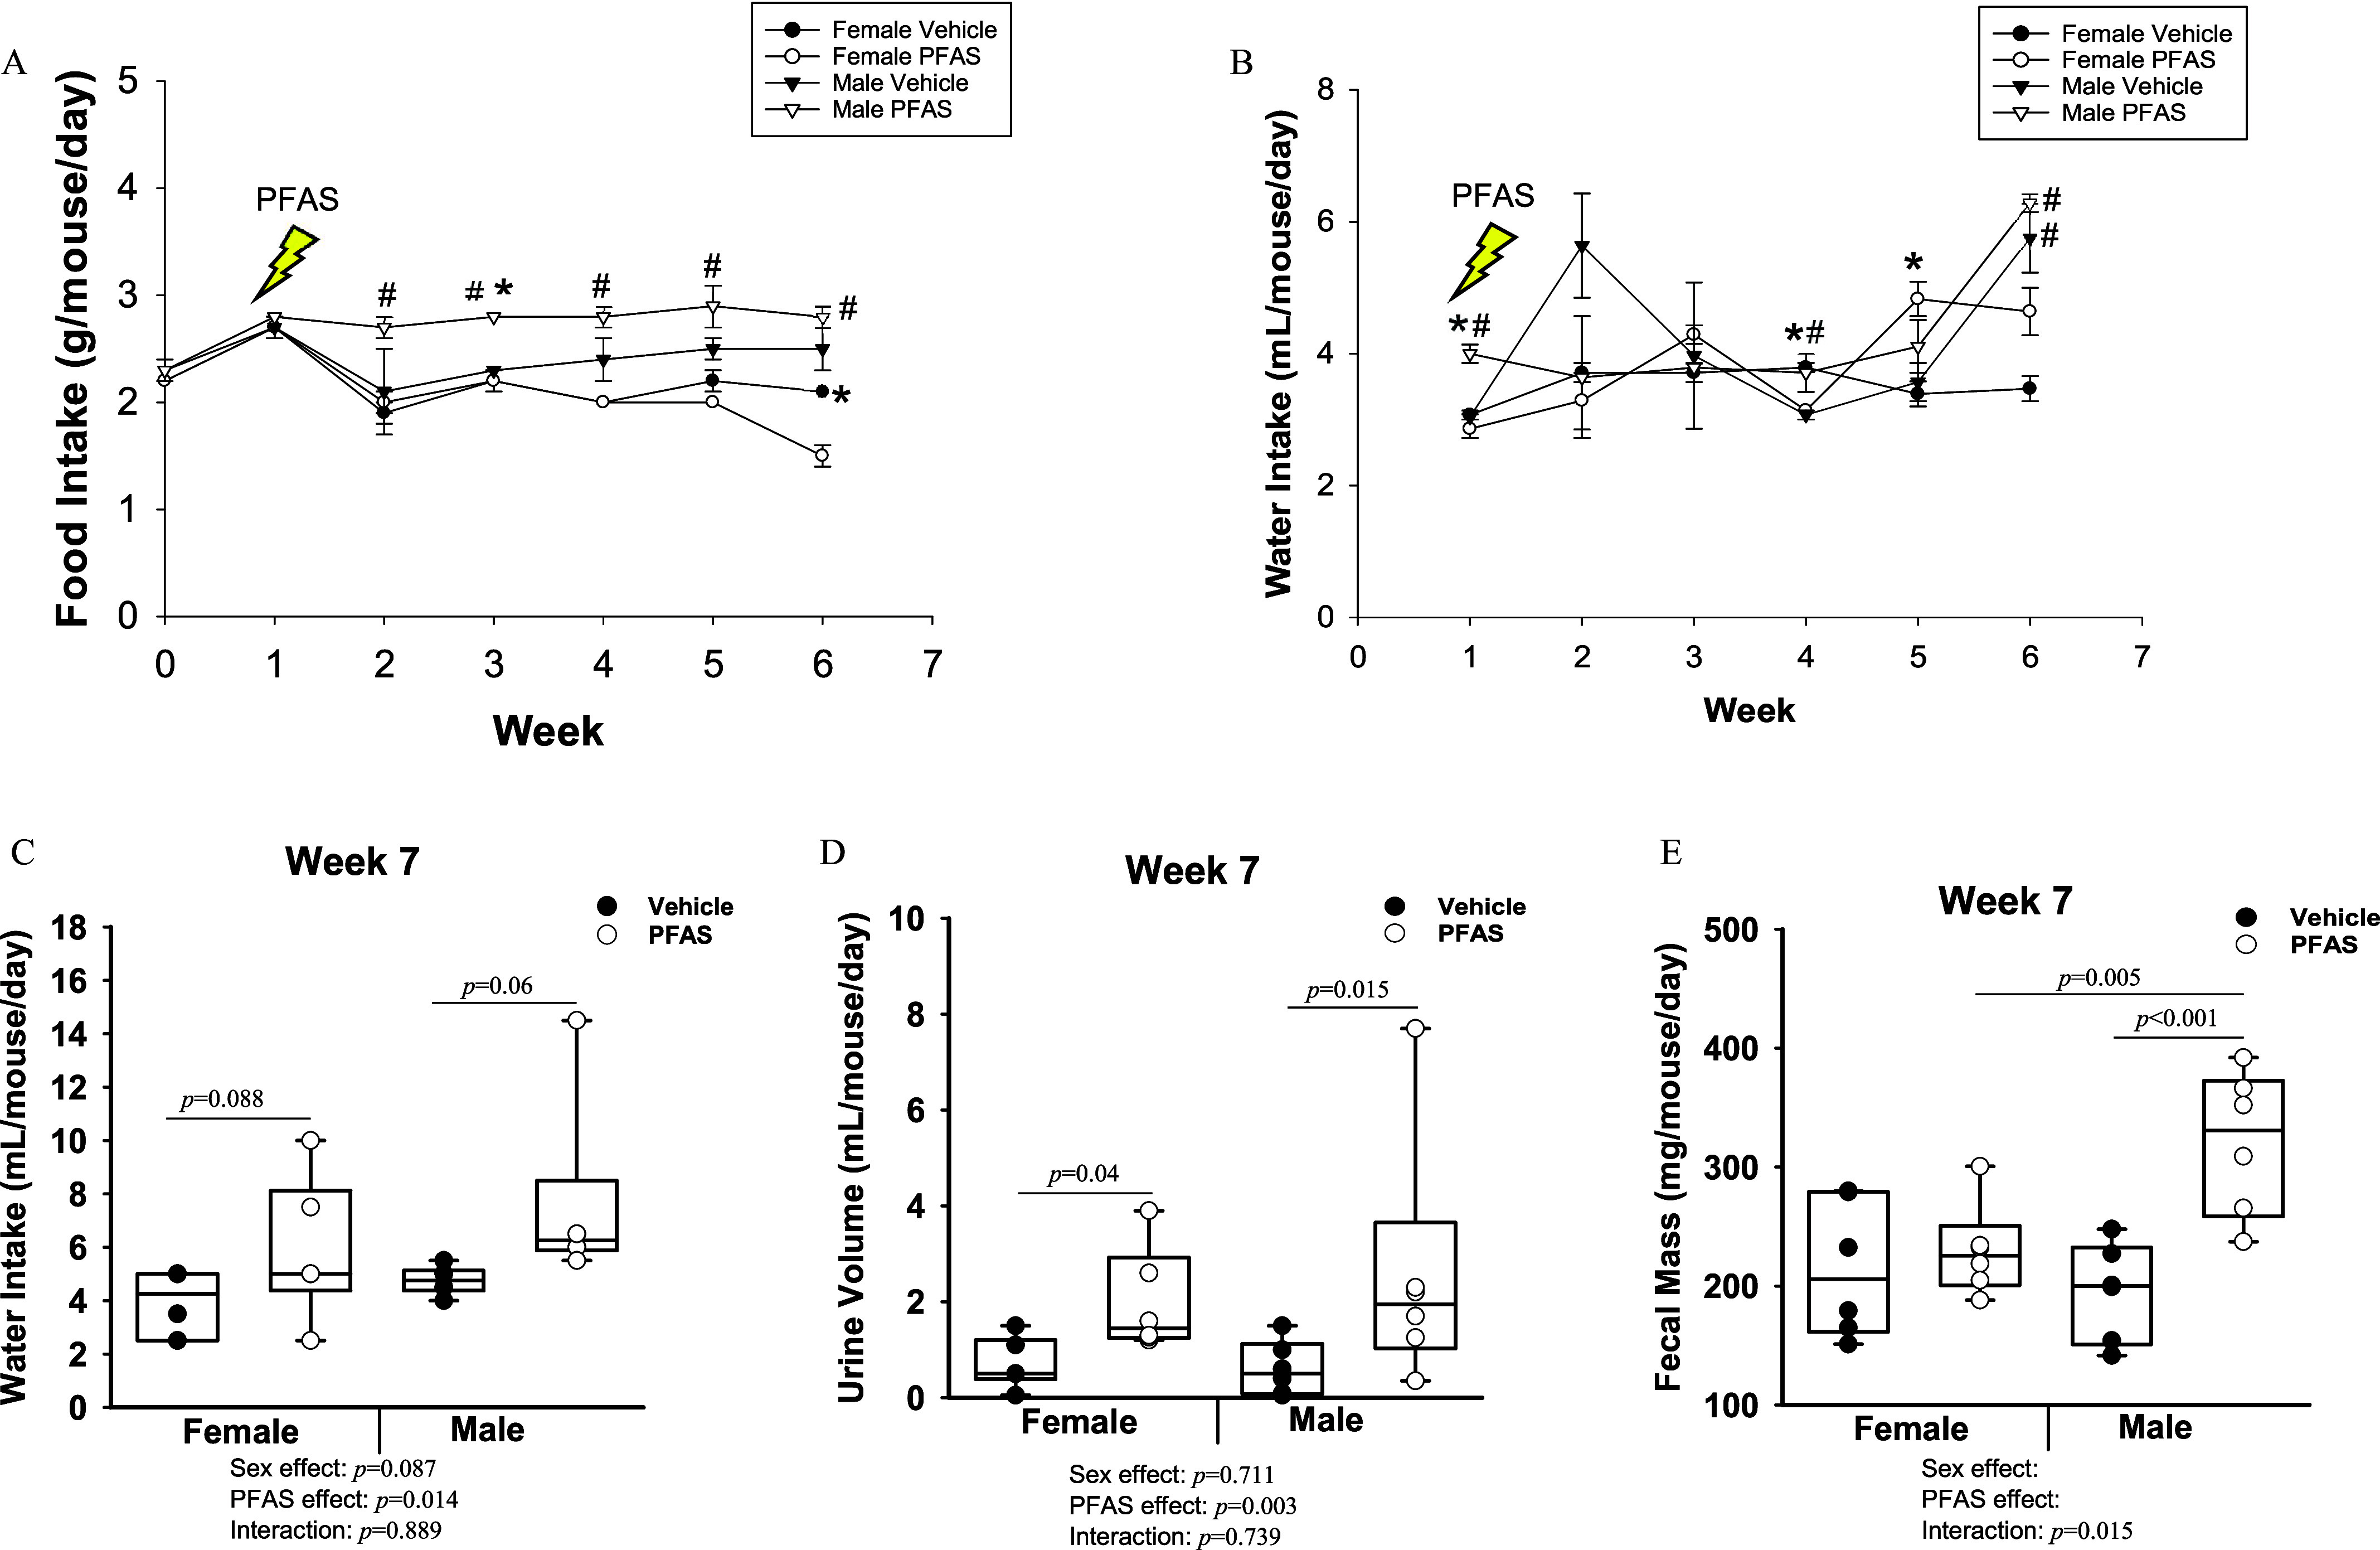
Figure 2.

Exposure of mice to the PFAS mixture and food and water intake, urine volume, and fecal mass. (A) The average food intake per mouse per day was calculated weekly for all mice of each group (). (B) Changes in water intake from the beginning of PFAS exposure to 6 wk of PFAS exposure. Mice were placed into urine and feces collection cages after week 6: (), (), (), and (). The indicated statistics for week 4 refer to PFAS-exposed females compared with vehicle control females. (C) The average water intake per mouse over a 24-h period in week 7. The total amount of (D) urine and (E) feces excreted over a 24-h period in week 7 are presented. Statistical significance for (A,B) () was determined by -test and the error bars represent the standard error of the mean. # compared with opposite sex of the same treatment. * comparing treatment groups within same sex. In (C–E), two-way ANOVA was used to analyze both main effects (i.e., sex, PFAS), as well as the interaction between sex and PFAS (interaction ). The Holm–Sidak post hoc test was used for multiple comparisons. With past consultation from biostatisticians, a significant interaction term supersedes the main effects and can make their meaning unclear. We therefore have not included the main effects -values for any result with a significant interaction. Box plots represent the median values with upper and lower quartiles; whiskers extend to the 1st and 99th percentiles. Data are reported in Excel Tables S4–S6. Note: ANOVA, analysis of variance; Ldlr, low density lipoprotein receptor; PFAS, per- and polyfluoroalkyl substances.
