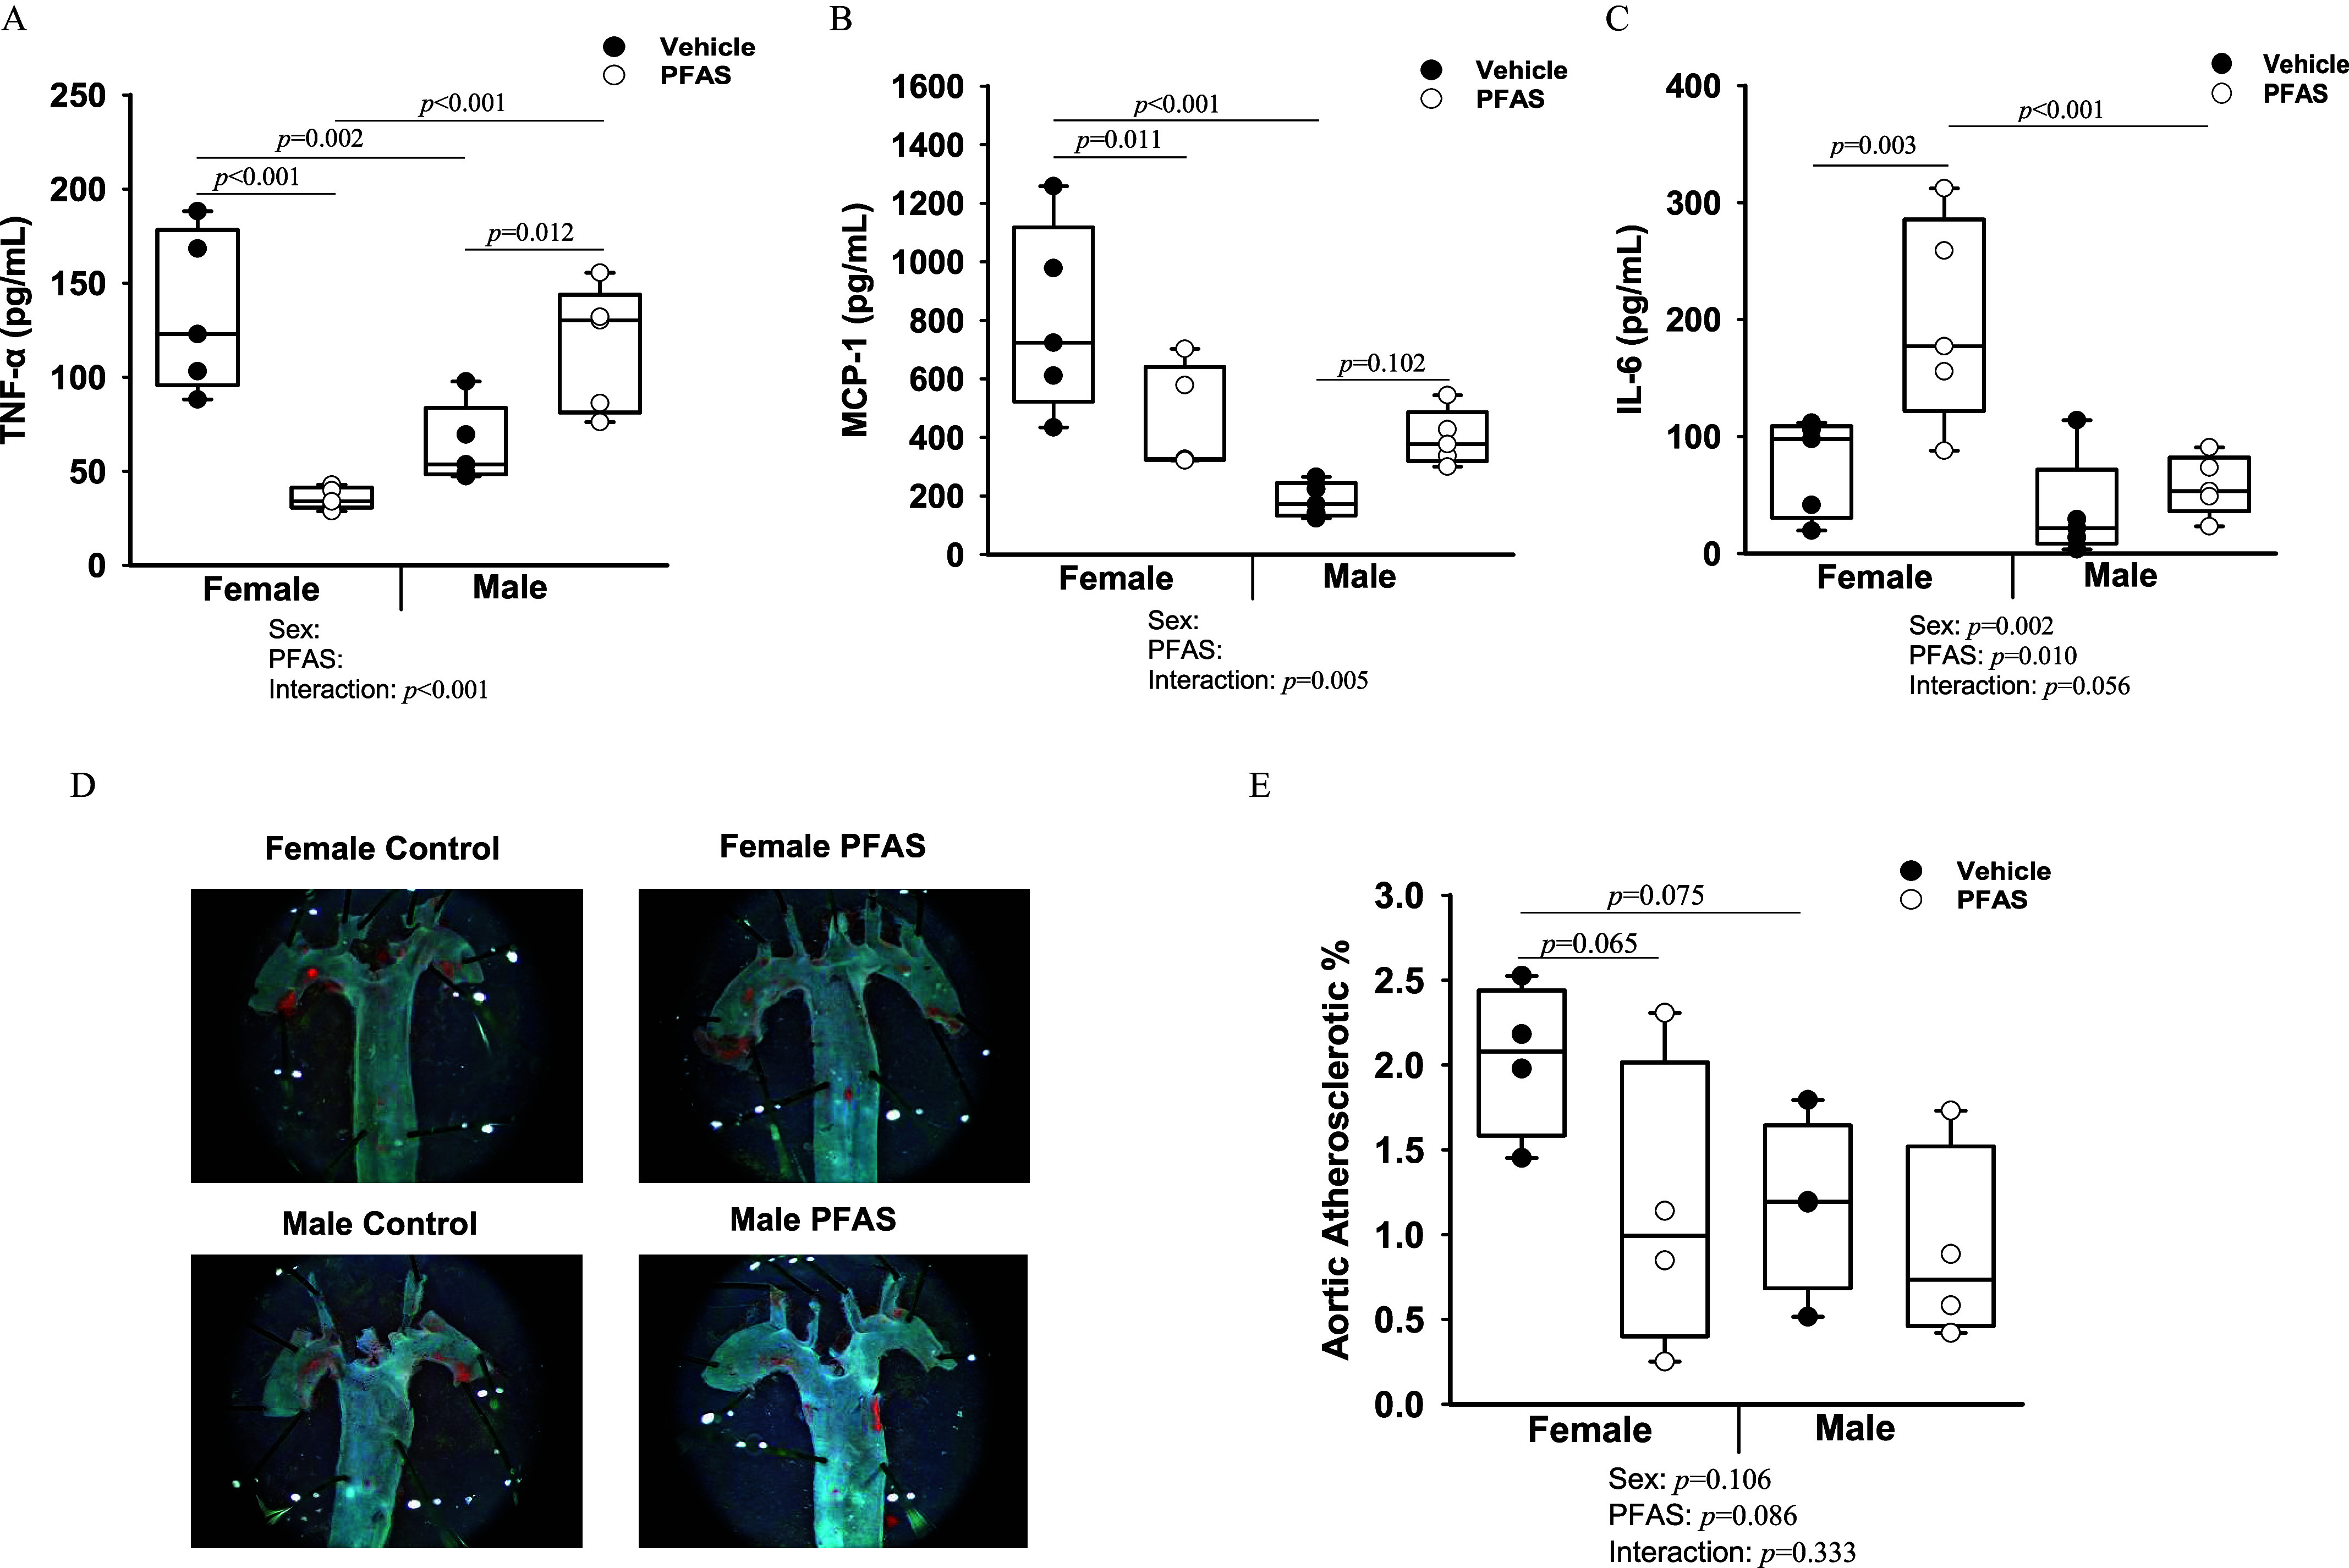
Figure 4.

Exposure of mice to the PFAS mixture for 7 wk and inflammatory and atherosclerotic outcomes. Circulating cytokine protein levels for (A) TNF-, (B) MCP-1, and (C) IL-6 were measured from plasma collected at euthanasia from mice of each treatment group (). (D) En face aortas were stained with Oil Red O for mice per treatment group and representative images of stained aortas are shown. (E) The percentage of staining was quantified to determine aortic atherosclerotic percentage. Two-way ANOVA was used to analyze both main effects (i.e., sex, PFAS), as well as the interaction between sex and PFAS (interaction ). The Holm–Sidak post hoc test was used for multiple comparisons. With past consultation from biostatisticians, a significant interaction term supersedes the main effects and can make their meaning unclear. We therefore have not included the main effects -values for any result with a significant interaction. Box plots represent the median values with upper and lower quartiles; whiskers extend to the 1st and 99th percentiles. Data are reported in Excel Tables S9 and S10. Note: ANOVA, analysis of variance; IL, interleukin; Ldlr, low density lipoprotein receptor; MCP, monocyte chemoattractant protein; PFAS, per- and polyfluoroalkyl substances; TNF, tumor necrosis factor.
