. 2024 Aug 23;132(8):087007. doi: 10.1289/EHP14339

Figure 6.

Figures 6A, 6B, 6D, 6E, 6F are box and whisker plots, plotting Hepatic cholesterol (micrograms per milligram hepatic protein), ranging as 2.0 e plus 4, 4.0 e plus 4, 6.0 e plus 4, 8.0 e plus 4, 1.0 e plus 5, 1.2 e plus 5, and 1.4 e plus 5; Hepatic 3-hydroxy-3-methylglutaryl-CoA reductase messenger ribonucleic acid fold change, ranging from 0.0 to 2.0 in increments of 0.5; Hepatic bile acids (nanomoles per milligram hepatic protein), ranging from 0 to 25 in increments of 5; Hepatic Cholesterol 7 alpha-hydroxylase messenger ribonucleic acid fold change, ranging from 0.0 to 3.0 in increments of 0.5; Hepatic cytochrome P450 family 27 subfamily A member 1 messenger ribonucleic acid fold change, ranging from 0.0 to 3.0 in increments of 0.5 (y-axis) across Female and Male, each including sex effect, per- and polyfluoroalkyl substances, and interaction (x-axis) for vehicle and per- and polyfluoroalkyl substances, respectively. Figure 6C depicts a flowchart with eight steps. Step 1: H M G-CoA and Hepatic 3-hydroxy-3-methylglutaryl-CoA reductase produced mevalonate. Step 2: Mevalonate produced Squalene. Step 3: Squalene produced Lanosterol. Step 4: Lanosterol and Cholesterol produced Cholesterol 7 alpha-hydroxylase and cytochrome P450 family 27 subfamily A member 1. Step 5: Cholesterol 7 alpha-hydroxylase produced 7 lowercase alpha-hydroxycholesterol and cytochrome P450 family 27 subfamily A member 1 produced 27-hydroxycholetserol. Step 6: 7 lowercase alpha-hydroxycholesterol with Hsd37 resulted in 7 lowercase alpha-hydroxy-4-cholestene-3-one, while 27-hydroxycholetserol with Cyp7b1 resulted in 3 lowercase beta, 7 lowercase alpha-dihydroxy-5-cholestanoic acid. Step 7: 7 lowercase alpha-hydroxy-4-cholestene-3-one with Cy8b1 produced cholic acid. The combination of 7 lowercase alpha-hydroxy-4-cholestene-3-one and akr1d1 produced chenodeoxycholic acid. Step 8: 3 lowercase beta, 7 lowercase alpha-dihydroxy-5-cholestanoic acid produced chenodeoxycholic acid.

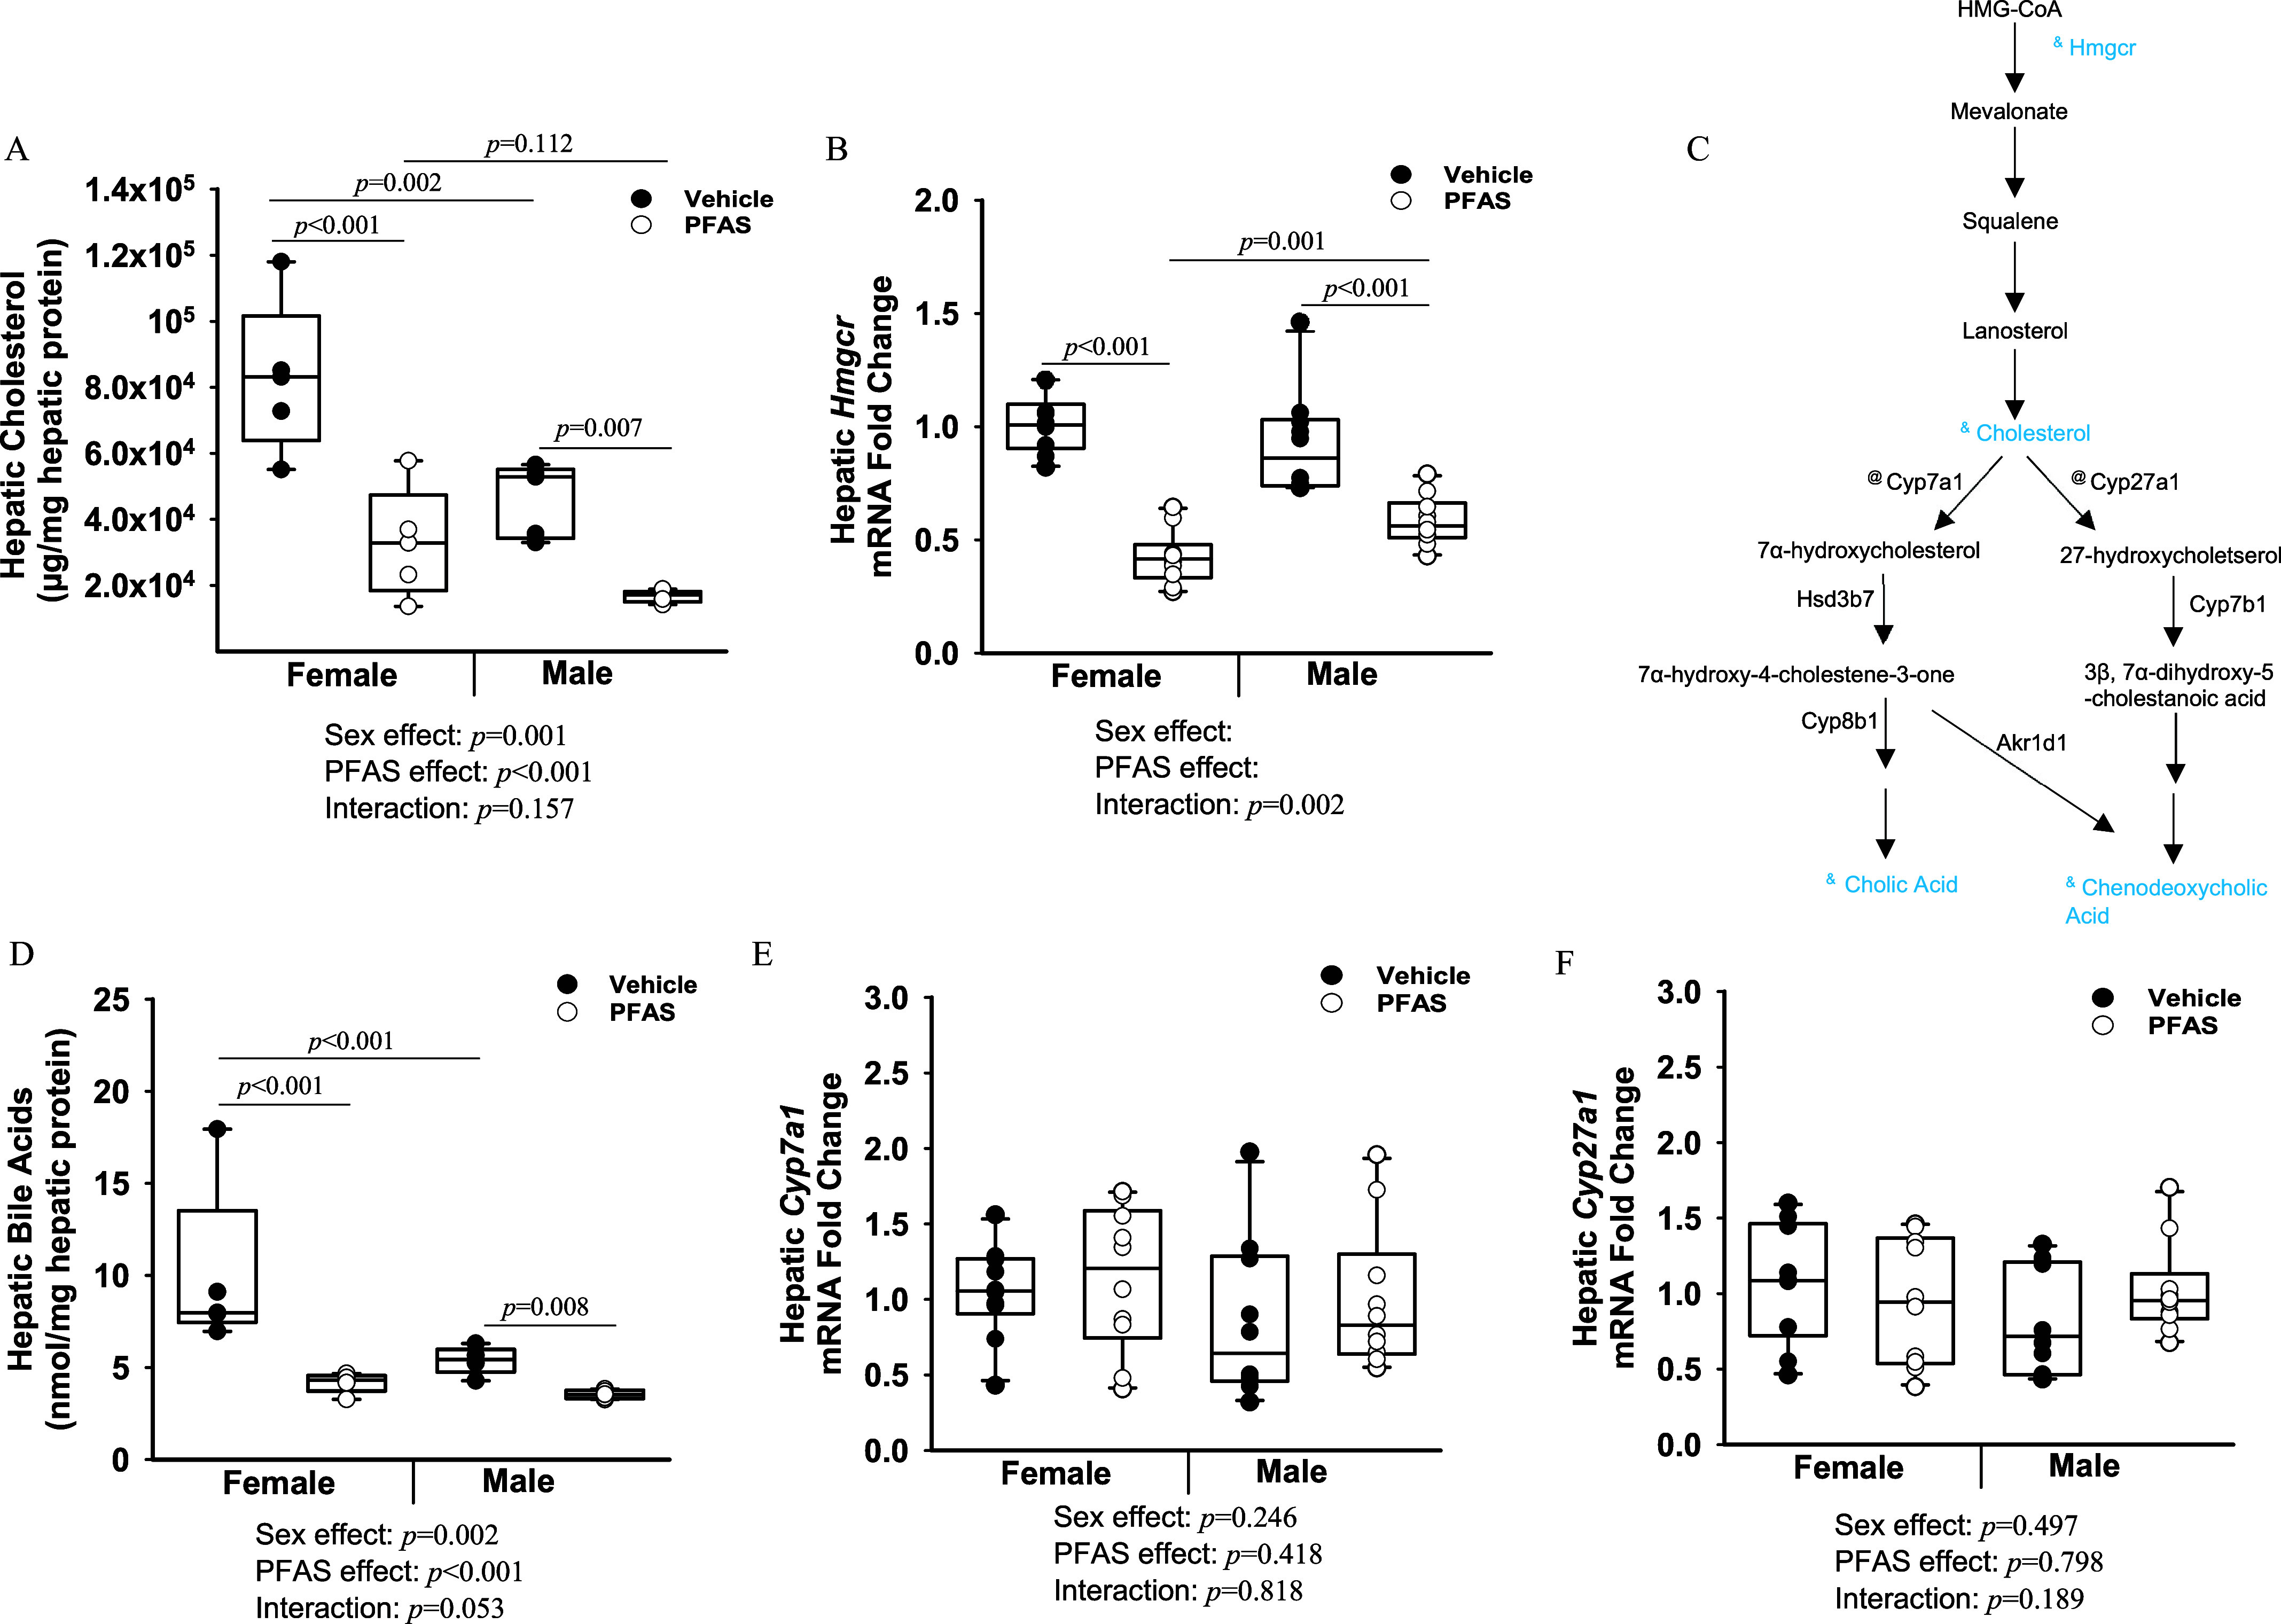
Exposure to the PFAS mixture, hepatic cholesterol and bile acid levels, and synthesis pathways. (A) Hepatic protein was isolated from n=5 mice from each treatment group and hepatic total cholesterol levels were measured. (B) Total hepatic RNA (n=10 mice from each treatment group) was isolated, and gene expression levels of Hmgcr were determined by RT-qPCR. (C) Diagram of hepatic cholesterol and bile acid synthesis pathways. Steps preceded by “&” represent a significant reduction, whereas those measured and not significantly affected are preceded by “@.” (D) Hepatic total bile acid levels. Gene expression levels of (E) Cyp7a1, and (F) Cyp27a1 were determined by RT-PCR. GAPDH was used as a housekeeping gene. Two-way ANOVA was used to analyze both main effects (i.e., sex, PFAS), as well as the interaction between sex and PFAS (interaction p<0.05). The Holm–Sidak post hoc test was used for multiple comparisons. With past consultation from biostatisticians, a significant interaction term supersedes the main effects and can make their meaning unclear. We therefore have not included the main effects p-values for any figure with a significant interaction. Box plots represent the median values with upper and lower quartiles; whiskers extend to the 1st and 99th percentiles. Data are reported in Excel Tables S12 and S13. Note: ANOVA, analysis of variance; GAPDH, glyceraldehyde 3-phosphate dehydrogenase; HMG-CoA, 3-hydroxy-3-methylglutaryl coenzyme A; PFAS, per- and polyfluoroalkyl substances; RT-qPCR, real-time quantitative polymerase chain reaction.