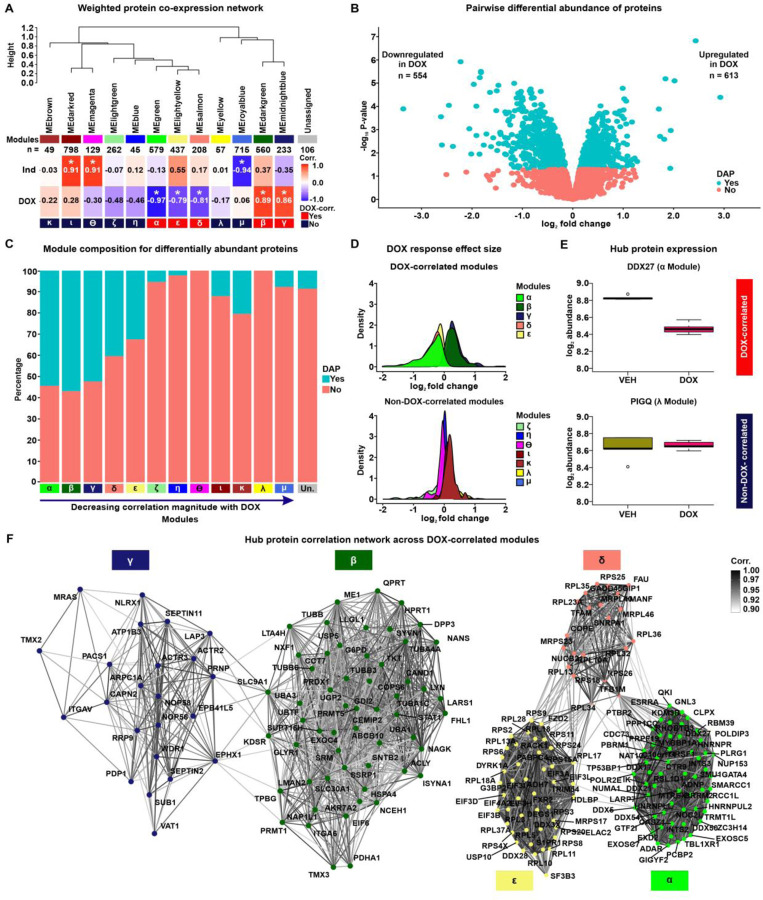
Figure 2: Network analysis of the iPSC-CM proteome identifies protein co-expression modules correlated with DOX treatment.
(A) Hierarchical clustering of 12 co-expression module eigen (ME) proteins based on their Pearson correlation. Height represents the dissimilarity between ME proteins (1-corr.). Each module is represented by a color and the number of proteins in the module specified. The “Unassigned” module, shaded grey, includes proteins that cannot be represented by one of the 12 ME proteins. The correlation between each ME protein and the known biological variables: Individual (Ind) and DOX treatment is shown. Asterisk represents a significant correlation between the ME protein and the trait (*P < 0.01). Modules are designated by Greek letters in order of decreasing correlation with DOX and summarized as DOX-correlated modules (red), and non-DOX-correlated modules (dark blue). (B) Volcano plot representing proteins that are differentially abundant (DAPs; P < 0.05; blue) and not differentially abundant (salmon) between VEH- and DOX-treated iPSC-CMs. (C) Percentage of DAPs (blue) and non-DAPs (salmon) across co-expression modules where modules are ordered by decreasing correlation to DOX treatment, and amongst a module-unassigned set (grey). (D) Distribution of effect sizes of response to DOX treatment (log2 fold change from pairwise differential abundance model) for the five DOX-correlated and seven non-DOX-correlated modules. (E) Examples of hub protein abundance values in VEH- and DOX-treated iPSC-CMs in a DOX-correlated module (α; DDX27) and a non-DOX-correlated module (λ; PIGQ). (F) DOX-correlated hub protein co-expression correlation network, where nodes are hub proteins and edges represent the weighted correlation between them. Connections among DOX-correlated proteins with a correlation of ≥ 0.9 are depicted for visualization.

