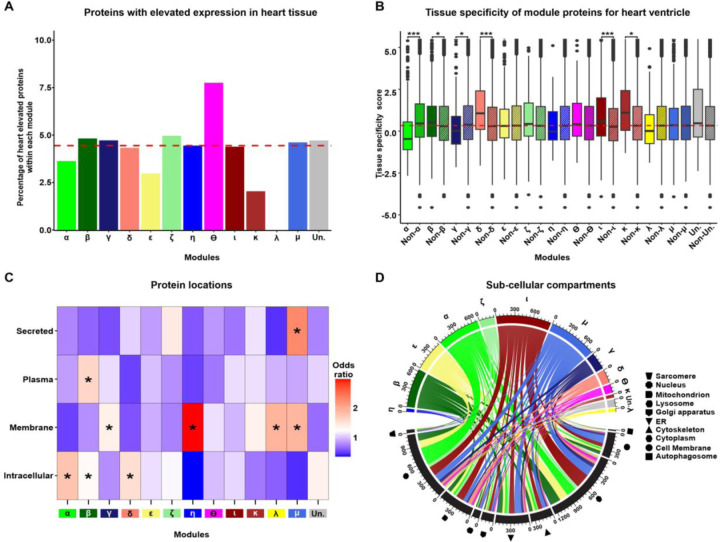
Figure 3: Network modules display heterogeneity for cellular localization and tissue specificity.
(A) Percentage of each module in the network that consists of proteins annotated as having increased expression in heart relative to other tissues (20). Dashed red line represents the median percentage of heart elevated proteins across all modules. (B) Comparison of heart ventricle tissue specificity scores for each module (x) in the network compared to proteins in all other modules (Non-x). The red dashed line indicates the median tissue specificity score for the network. Asterisk represents statistically significant differences in tissue-specificity scores between module proteins and non-module proteins (*P < 0.01, ***P < 0.0001). (C) Enrichment of module proteins across cellular and extracellular compartments. Asterisk represents locations with a significant enrichment of module proteins (*P < 0.05). (D) Distribution of module proteins across subcellular compartments. Colors represent the set of proteins in each module and shapes represent the cellular compartments. Numbers indicate the number of proteins in each module or compartment.

