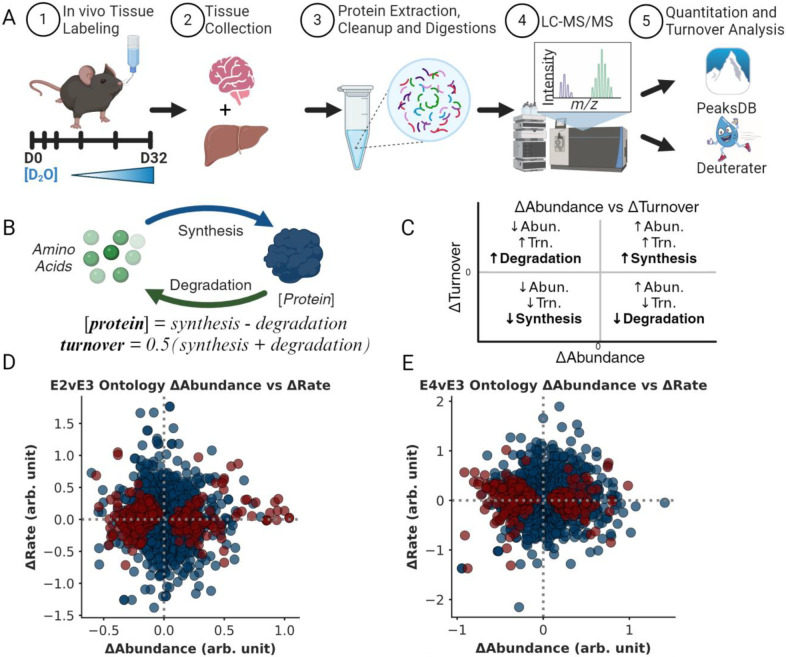
Figure 1.
Testing for changes in regulation of the brain proteome A. Homozygous ApoE transgenic mice (ApoE2, E3, or E4, n = 24 each) were given 8% D2O drinking water and sacrificed at specific timepoints ranging from day 0 to day 32. Tissues were prepared using the S-Trap protocol and analyzed via LC-MS. Data-dependent acquisition was used to collect data for LFQ analysis and MS1 level data was used to calculate turnover rate values for each protein. Resulting spectra from MS/MS acquisitions were analyzed by Peaks Studio (Bioinformatics Solutions Inc.) peptide-protein identification (IDs) and quantitation while Deuterater1 software was used for turnover rate calculation. B. Proteostasis model where protein expression levels and turnover rates are a function of synthesis and degradation. C. Regulation of synthesis and degradation can be inferred from Δabundance (x-axis) and Δturnover (y-axis) and visualized using a proteostasis plot. D & E. Proteostasis plot showing 276

