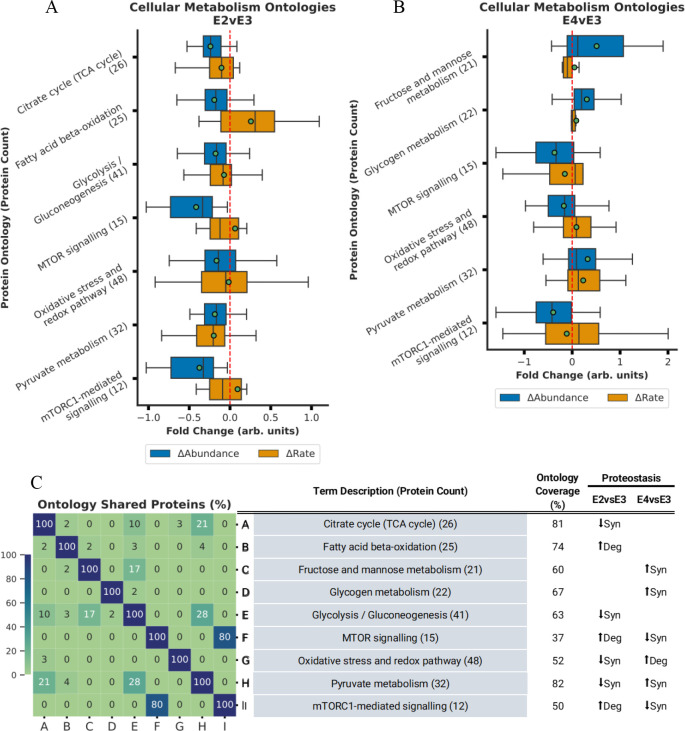
Figure 4.
ApoE2 and ApoE4 expression drive changes in cellular fuel selection A-B. Bar plot displaying Δabundance (orange) and Δturnover (blue) for ontologies of proteins detected in all experimental cohorts belonging to oxidative phosphorylation with significant* Δabundance in the E2vsE3 comparison (A) and in the E4vsE3 comparison (B). C. Heatmap displaying % of proteins shared across the oxidative phosphorylation ontologies with significant* Δabundance. (*BH-PV < 0.05.

