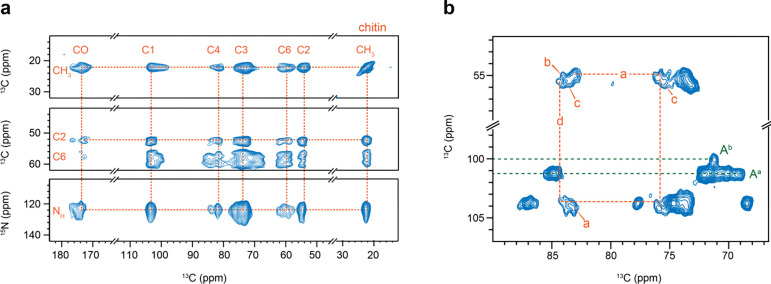
Figure 3. Structural complexity of chitin and α-glucan in A. nidulans.
(a) Chitin signals resolved by 2D 13C-13C PAR correlation spectrum (top and middle) and 2D 15N-13C correlation spectrum (bottom panel). These spectra were measured using DNP for sensitivity enhancement. (b) Peak multiplicity observed in 2D 13C-13C CORD correlation spectrum. Dashed lines in orange show the carbon connectivity of type-a and type-d chitin. Dashed lines in green show the signals of type-a (Aa) and type-b (Ab) α−1,3-glucan.

