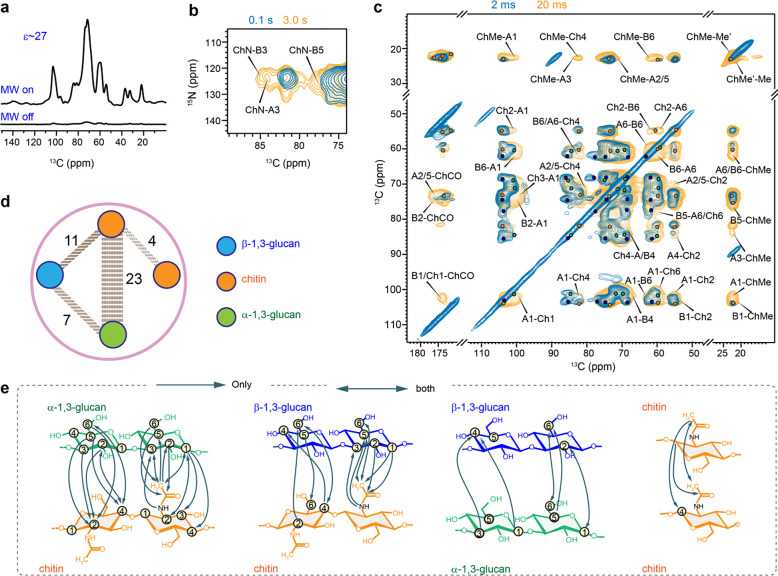
Figure 5. DNP-supported view of intermolecular interactions of A. nidulans polysaccharides.
(a) An DNP enhancement of 27-fold was achieved on A. nidulans when comparing the spectra measured with and without microwave (MW). (b) Overlay of 2D 15N-13C correlation spectra measured with short (0.1 s; turquoise) and long (3.0 s; yellow) 13C-13C mixing periods (c) Overlay of two 2D 13C-13C correlation spectra measured with 20 ms (yellow) and 2 ms (turquoise) PAR mixing periods. Labels are provided only for the long-range intermolecular cross peaks uniquely present in the 20 ms PAR spectrum. (d) Overview of intermolecular cross peaks detected among different polysaccharides: β-glucans (blue), α-glucans (green) and chitin (orange). The dash lines represent the number of intermolecular interactions between the glucans. (e) Structural summary of intermolecular interactions observed in A. nidulans. The NMR polarization-based interactions have directionality as shown using arrow heads. For example, a cross peak may be observed from the C3 of α−1,3-glucan to the methyl of chitin (A3-ChMe), or vice versa (ChMe-A3).

