
Figure 11.
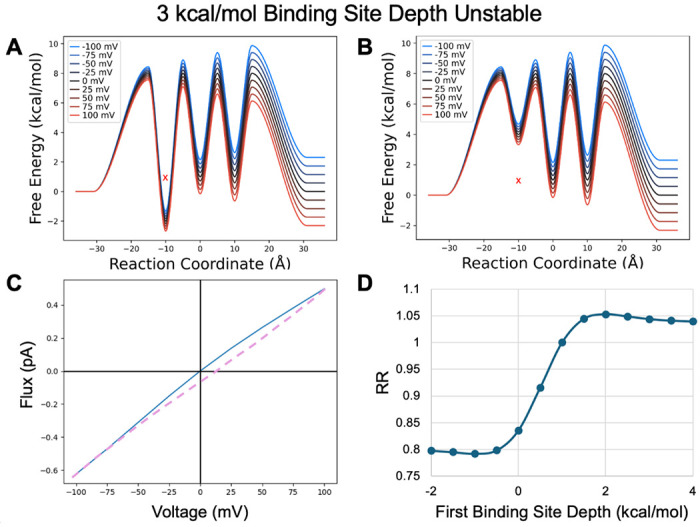
Model PMF with unstable binding sites transformed by shifting the first binding site depth from A) a minimum value of −2 kcal/mol to B) a maximum value of 4 kcal/mol in .5 kcal/mol increments. X indicates original binding site depth. C) IV curve for the PMF shown in A. D) RR as a function of binding site depth transformation.