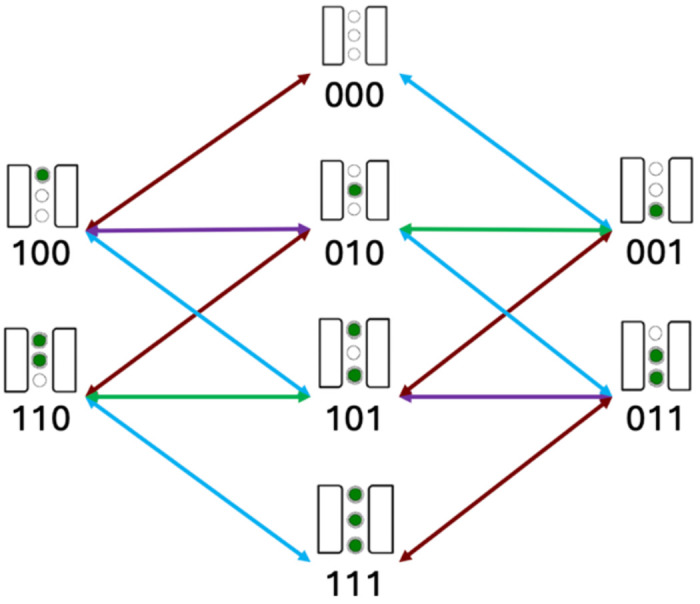
Figure 3.

Kinetic network used to model flux through ion channels. All edges of the same color represent rates with the same magnitude in the symmetric model. Forward and reverse rates have unique values. Ion binding in the channel is represented schematically above the binary string, with the upper site and left-most digit being representing the intracellular side, respectively.
