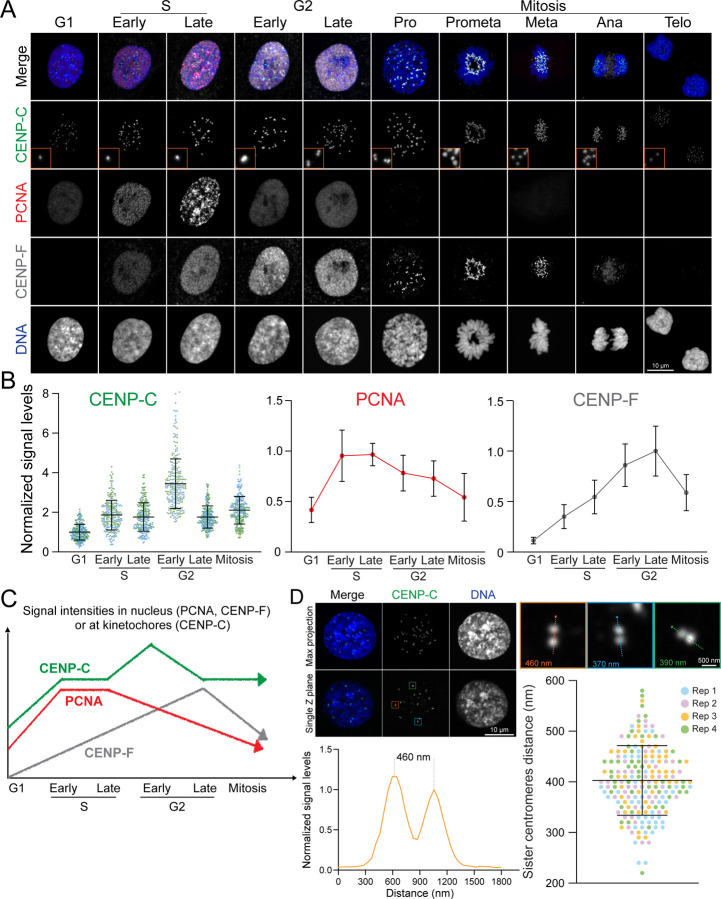
Figure 2: Immunofluorescence-based Identification of Cell Cycle Stages.
(A) Representative immunofluorescence images of cells at each cell cycle stage, labeled with CENP-C, PCNA, and CENP-F. (B) Quantification of relative nuclear signal intensities for PCNA, CENP-F, and CENP-C at different cell cycle stages. For PCNA and CENP-F, n = 20; for CENP-C, n = 10, kinetochores = 250 (from two replicates). (C) Schematic representation illustrating the dynamics of nuclear signal variations in CENP-C, CENP-F, and PCNA as markers for identifying each cell cycle stage. (D) Measurement of the distance between sister centromeres. Top: Representative image of late G2 phase cells. Bottom left: Line scan of the distance between sister centromeres. Bottom right: Quantification of sister centromere distance in late G2 stage. n = 200 (from four replicates).

