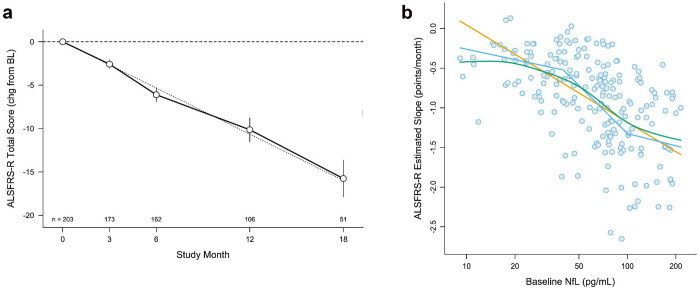
Figure 1. ALSFRS-R Slope and its Relationship to Baseline NfL.
(a) Random slopes model of ALSFRS-R over time, with errors bars showing 95% confidence intervals (CI). Faint grey dotted line illustrates the linear estimate of change in ALSFRS-R over time. (b) Relationship between baseline serum NfL (measured in duplicate) and future rate of progression of the ALSFRS-R (Spearman correlation coefficient = −0.57, 95% CI −0.66 to −0.47, p<0.0001) among n=203 study participants. The straight orange line shows the linear prediction. The bent blue line represents a partial-linear spline with knots chosen post-hoc at 40 and 100 pg/mL. The smooth green curve is a smoothing spline through the empirical Bayes slope estimates.

