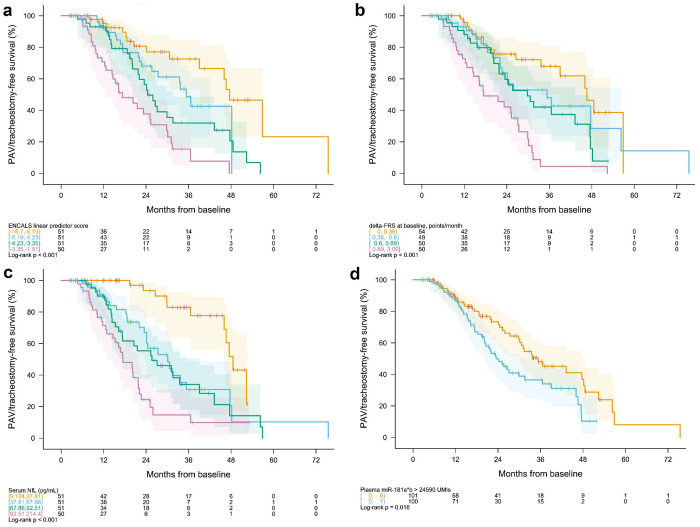
Figure 3. Kaplan-Meier Survival Curves.
Permanent assisted ventilation (PAV)- and tracheostomy-free survival for (a) the ENCALS predictor score, divided into quartiles; (b) ΔFRS, divided into quartiles; (c) baseline serum NfL, divided into quartiles; and (d) baseline plasma miR-181ab dichotomised at the median value of 24,590 UMI. The range of values for each clinical or biological marker within a defined quartile, as well as the number of observations at each time point, are shown below each KM plot. Shading represents pointwise log-log confidence intervals.

