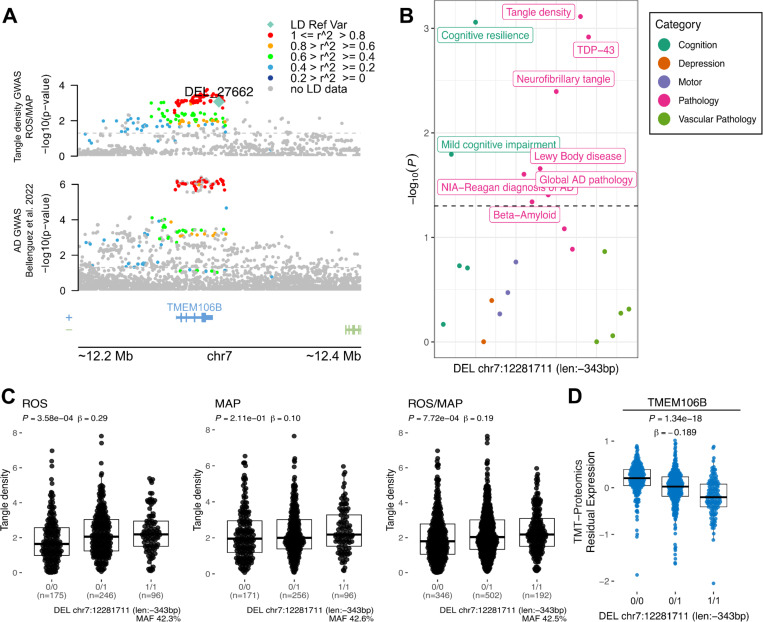
Figure 2. 343 bp deletion associated with tangle density at TMEM106B locus.
A, locus zoom plot for the TMEM106B locus (chr7:11,768,758–12,769,593) showing a 200 Kbp window around a 343 bp deletion with high LD with the lead SNP rs5011436. On the top, the y-axis shows the nominal P values (as −log10) for the association tests with tangle density in ROS/MAP participants. On the bottom, the y-axis shows the AD GWAS results from Bellenguez et al. (2022). The SV is plotted in a diamond shape, while SNPs are plotted in circles. Points are colored by the LD (R2) to the SV. The dashed line represents nominal P = 0.05. B, shows the nominal P values (as −log10) for the association of the SV with all AD/ADRD traits tested. Dots are colored by phenotype category. The dashed line represents nominal P = 0.05. C, Boxplots showing the tangle density measures by the deletion alleles (ROS, MAP, ROS/MAP). D, Boxplot shows the SV-pQTL between the deletion and protein expression levels of TMEM106B measured from DLPFC brain tissues of 663 ROS/MAP participants.

