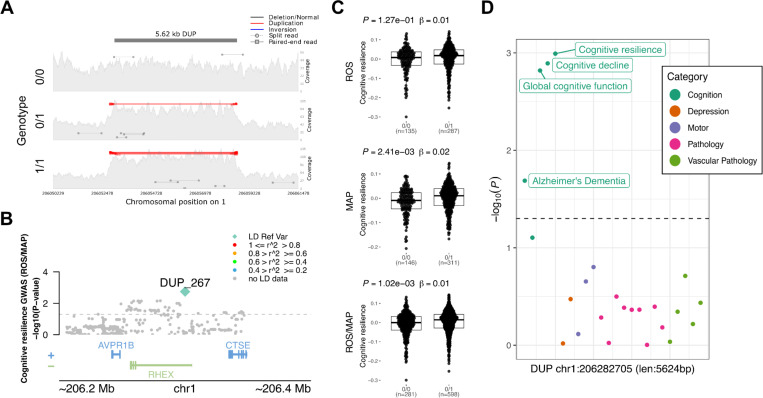
Figure 5. 5.6 Kbp duplication at the 1q31.1 locus associated with cognitive resilience.
A, mapping of sequencing reads at the locus from three representative individuals corresponding to the possible genotypes: duplication not present (0/0), heterozygous allele (0/1), and homozygous allele (1/1). B, locus zoom plot showing 200 Kbp window around the SV. The y-axis shows the nominal P values (as −log10) for the association tests with cognition in ROS/MAP participants. The SV is plotted in a diamond shape, while SNPs are plotted in circles. Points are colored by the LD (R2) to the SV. C, Boxplots showing the cognitive resilience measures by the duplication alleles (ROS, MAP, ROS/MAP). D, shows the nominal P values (as −log10) for the association of the SV with all other AD/ADRD traits tested. Dots are colored by phenotype category. The dashed line represents nominal P = 0.05.

