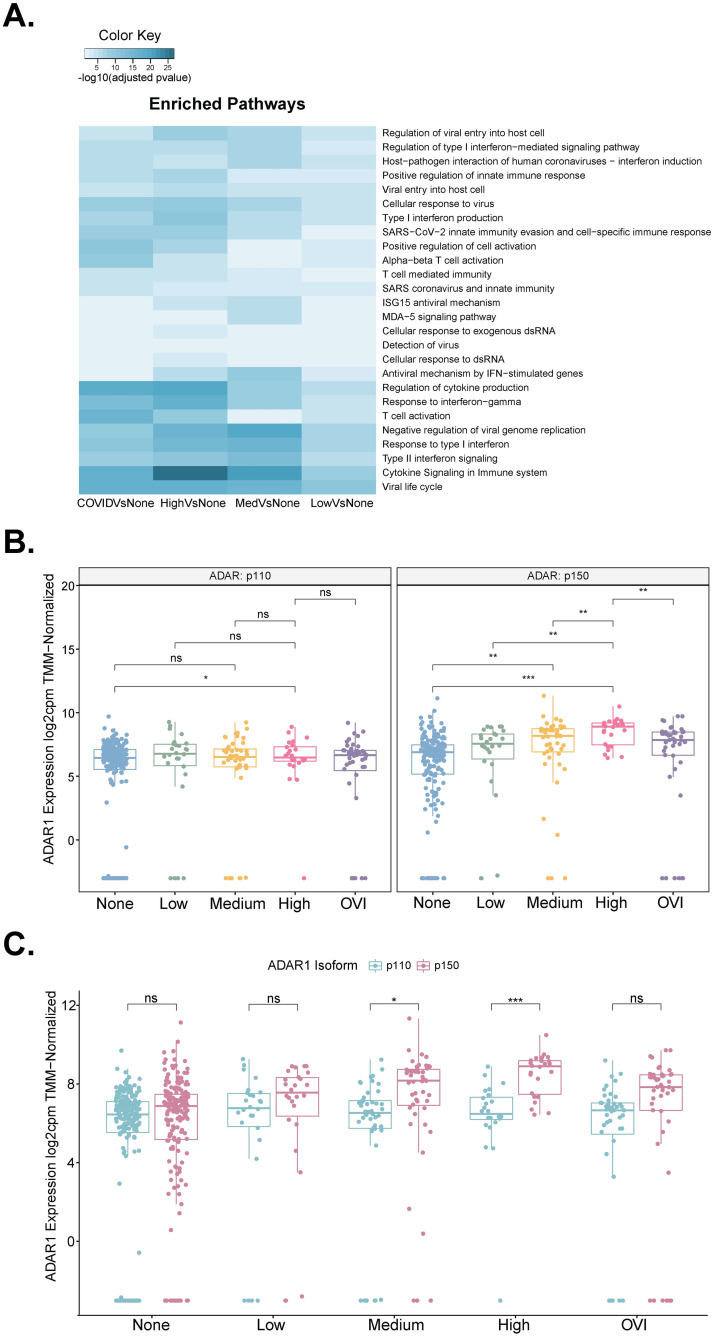
Fig 2. Differentially expressed genes and ADAR isoforms in SARS-CoV-2 infection.
a. Pathway analysis performed on differentially expressed genes between viral loads and other viral illness samples demonstrates the enrichment of pathways (Reactome and GO:BP) involved with immune cell response such as T cell activation involved in immune cells, and interferon signaling and responses. b. Gene expression of ADAR1 in COVID-19 viral load divided by isoforms p110 and p150 with a t-test comparison. * p < 0.05; ** p < 0.01; *** p < 0.001; ns: not significant. c. Gene expression of ADAR1 isoforms p110 and p150 divided by COVID viral load with a t-test comparison. * p < 0.05; *** p < 0.001; ns: not significant.

