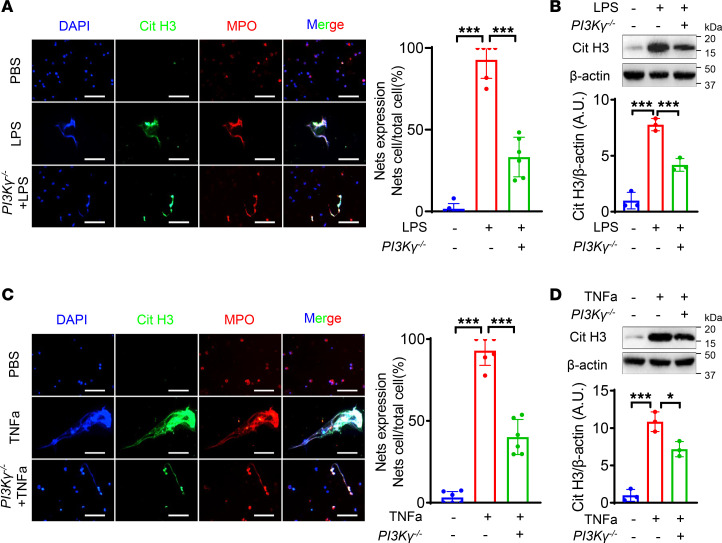
Figure 4. Deficiency of PI3Kγ inhibits NETs’ formation in neutrophils.
(A and C) Representative immunofluorescence staining images and quantitative comparison of NETs produced by neutrophils with different treatments: PBS (WT-derived neutrophils), LPS (5 μg/mL, WT-derived neutrophils), LPS (PI3Kγ–/––derived neutrophils), PBS (WT-derived neutrophils), TNF-α (50 ng/mL, WT-derived neutrophils), TNF-α (PI3Kγ–/––derived neutrophils). NETs were detected using immunofluorescence staining of DNA (DAPI, blue), citrullinated histone 3 (Cit H3, green), and myeloperoxidase (MPO, red). NETs’ expression was calculated by NET-expressing cell numbers/total cell numbers per high-power field (original magnification, 40×). n = 6. Scale bars, 50 μm. (B and D) Representative Western blot images and quantitative comparison of Cit H3 protein expression in each group of neutrophils with different treatments as described in A and C. n = 3. (A–D) One-way ANOVA followed by Fisher’s least significant difference post hoc test. *P < 0.05, and ***P < 0.001. PBS, phosphate-buffered saline.

